View Docs
Documentation
Database
Asset Library
Bulk Editor
Listing Explorer
Tag Analyzer
Shop Analyzer
Browser Extension
Print on Demand
Policies
Documentation
→
Tag Analyzer
→
Tag Analyzer Overview
Alek
Tag Analyzer Overview
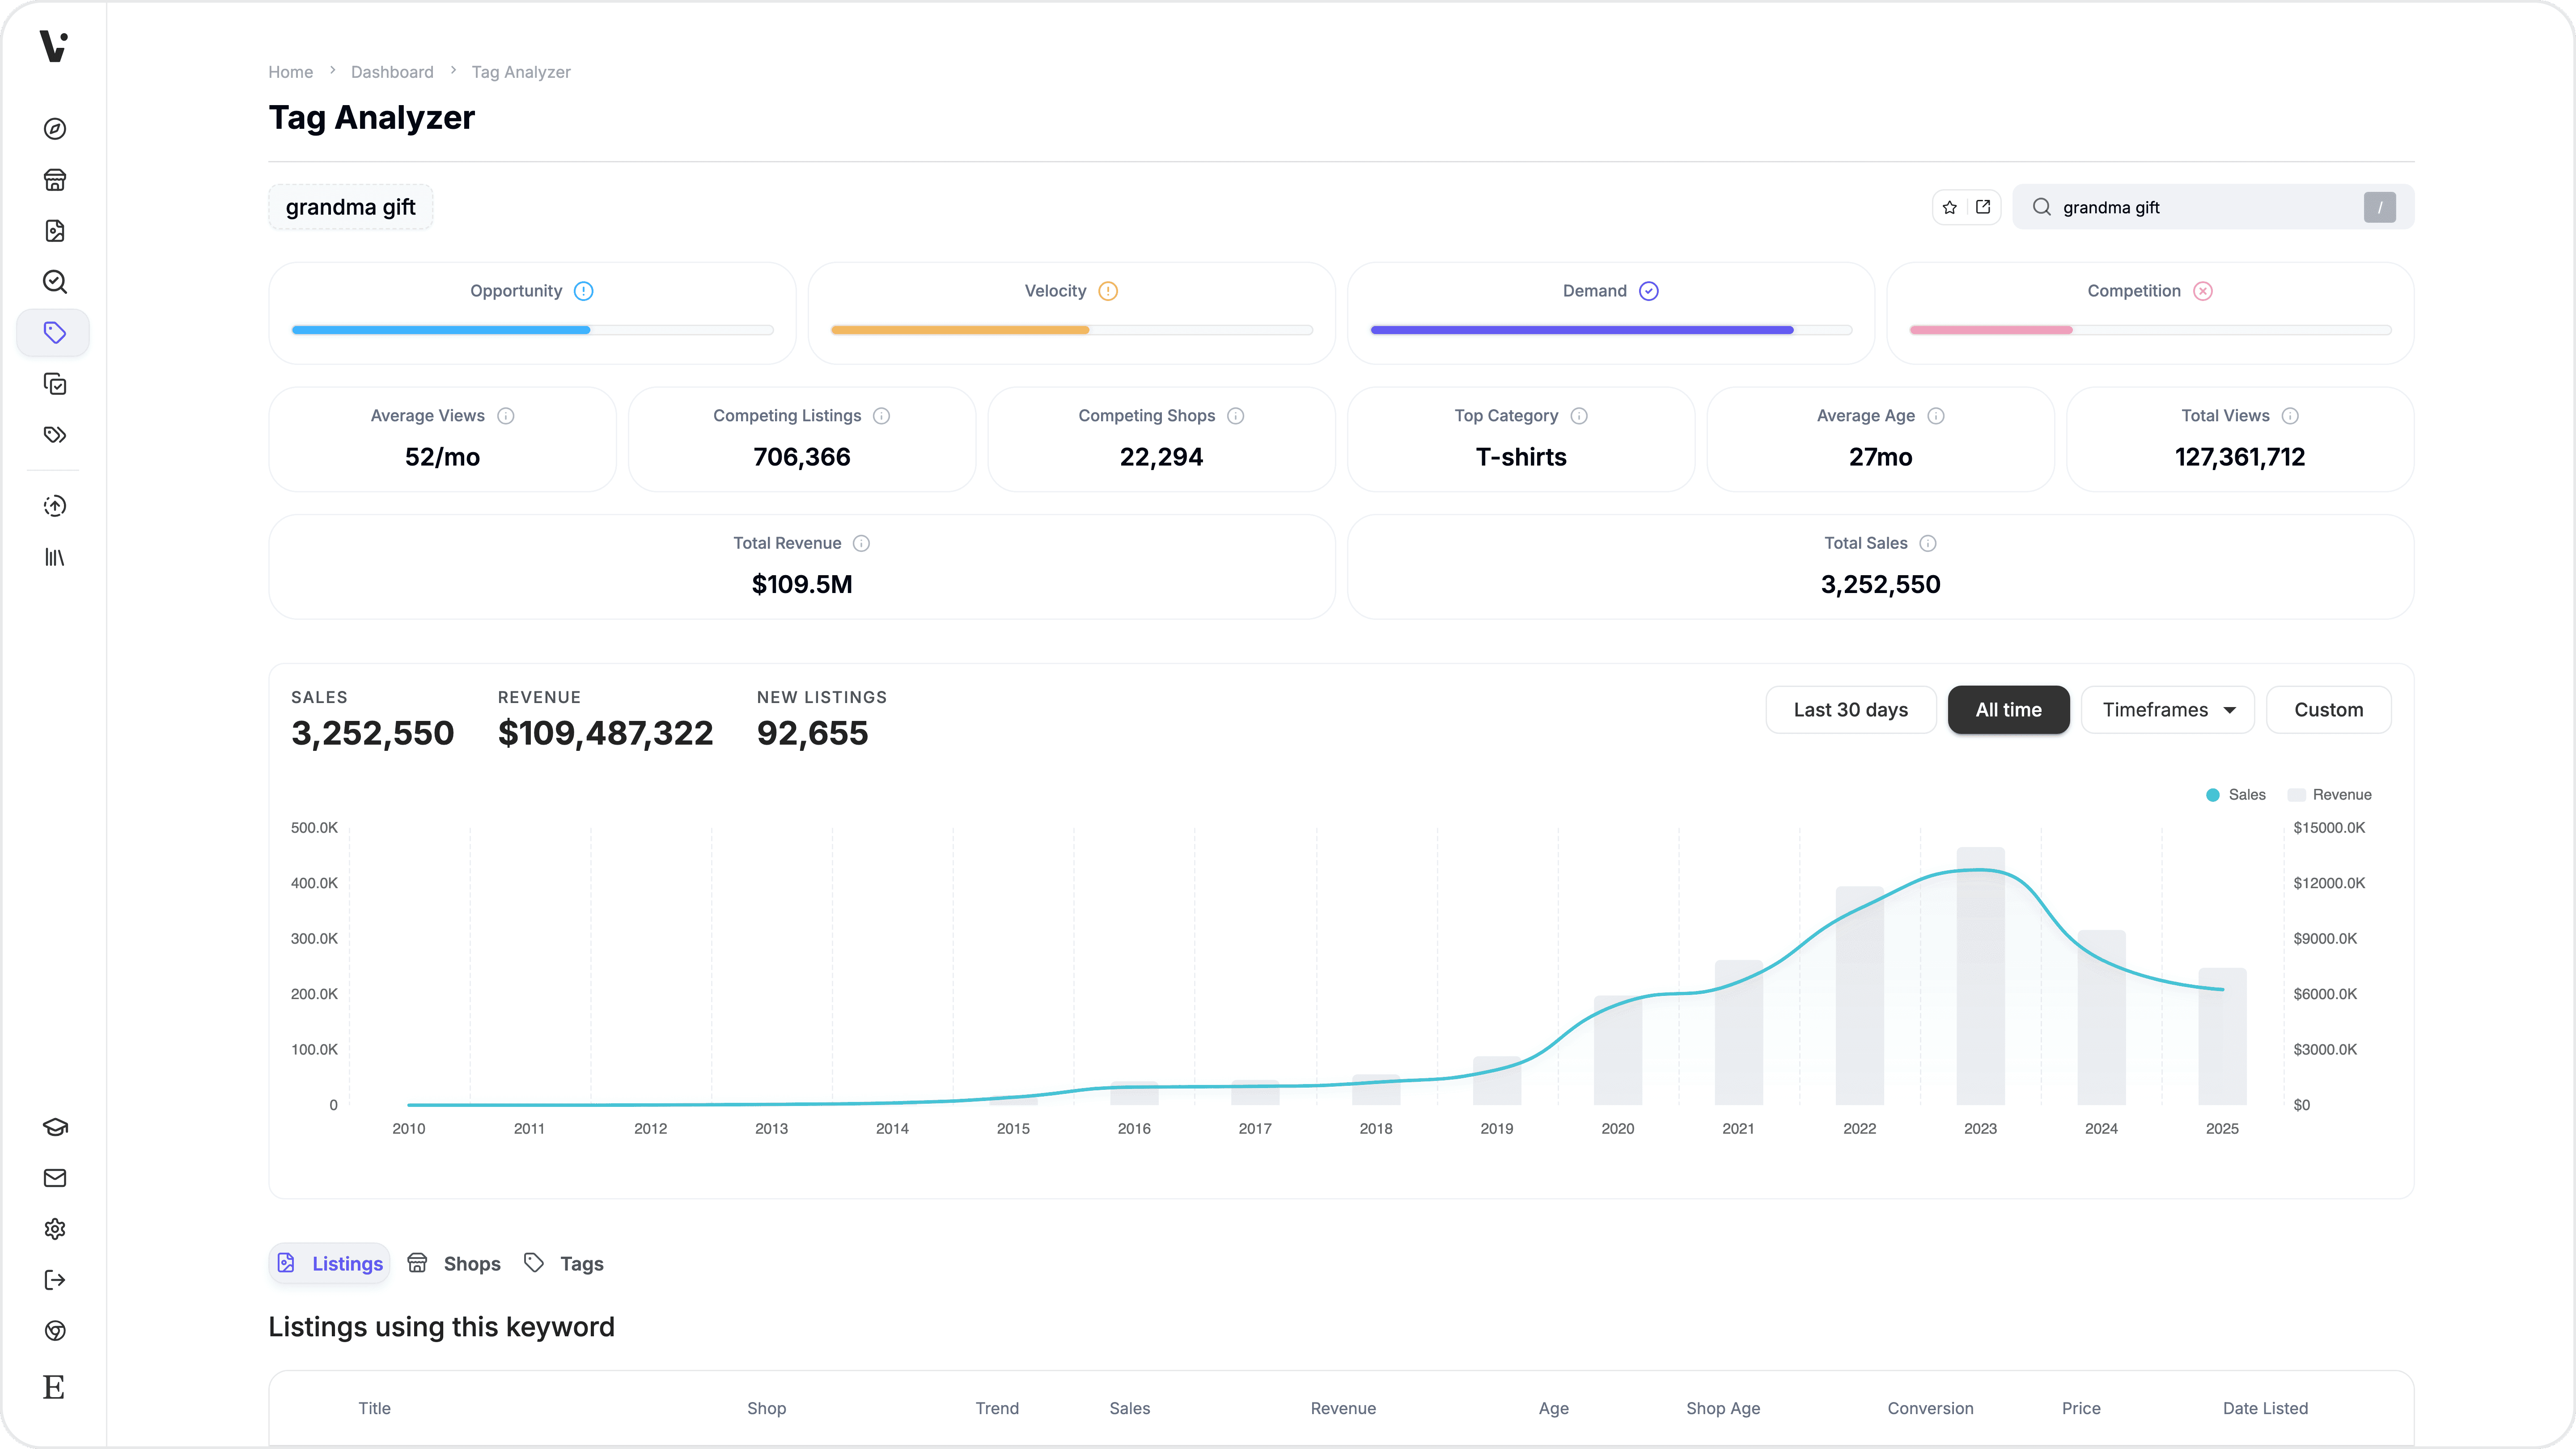
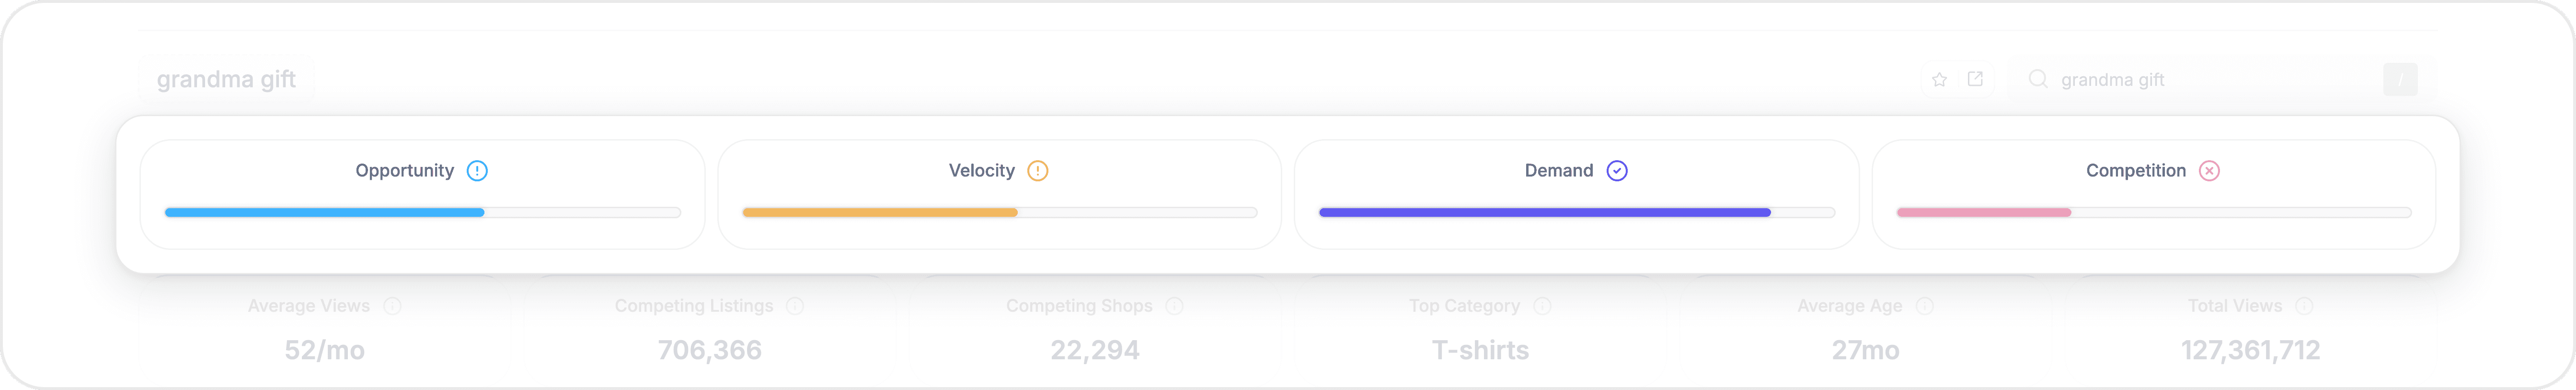
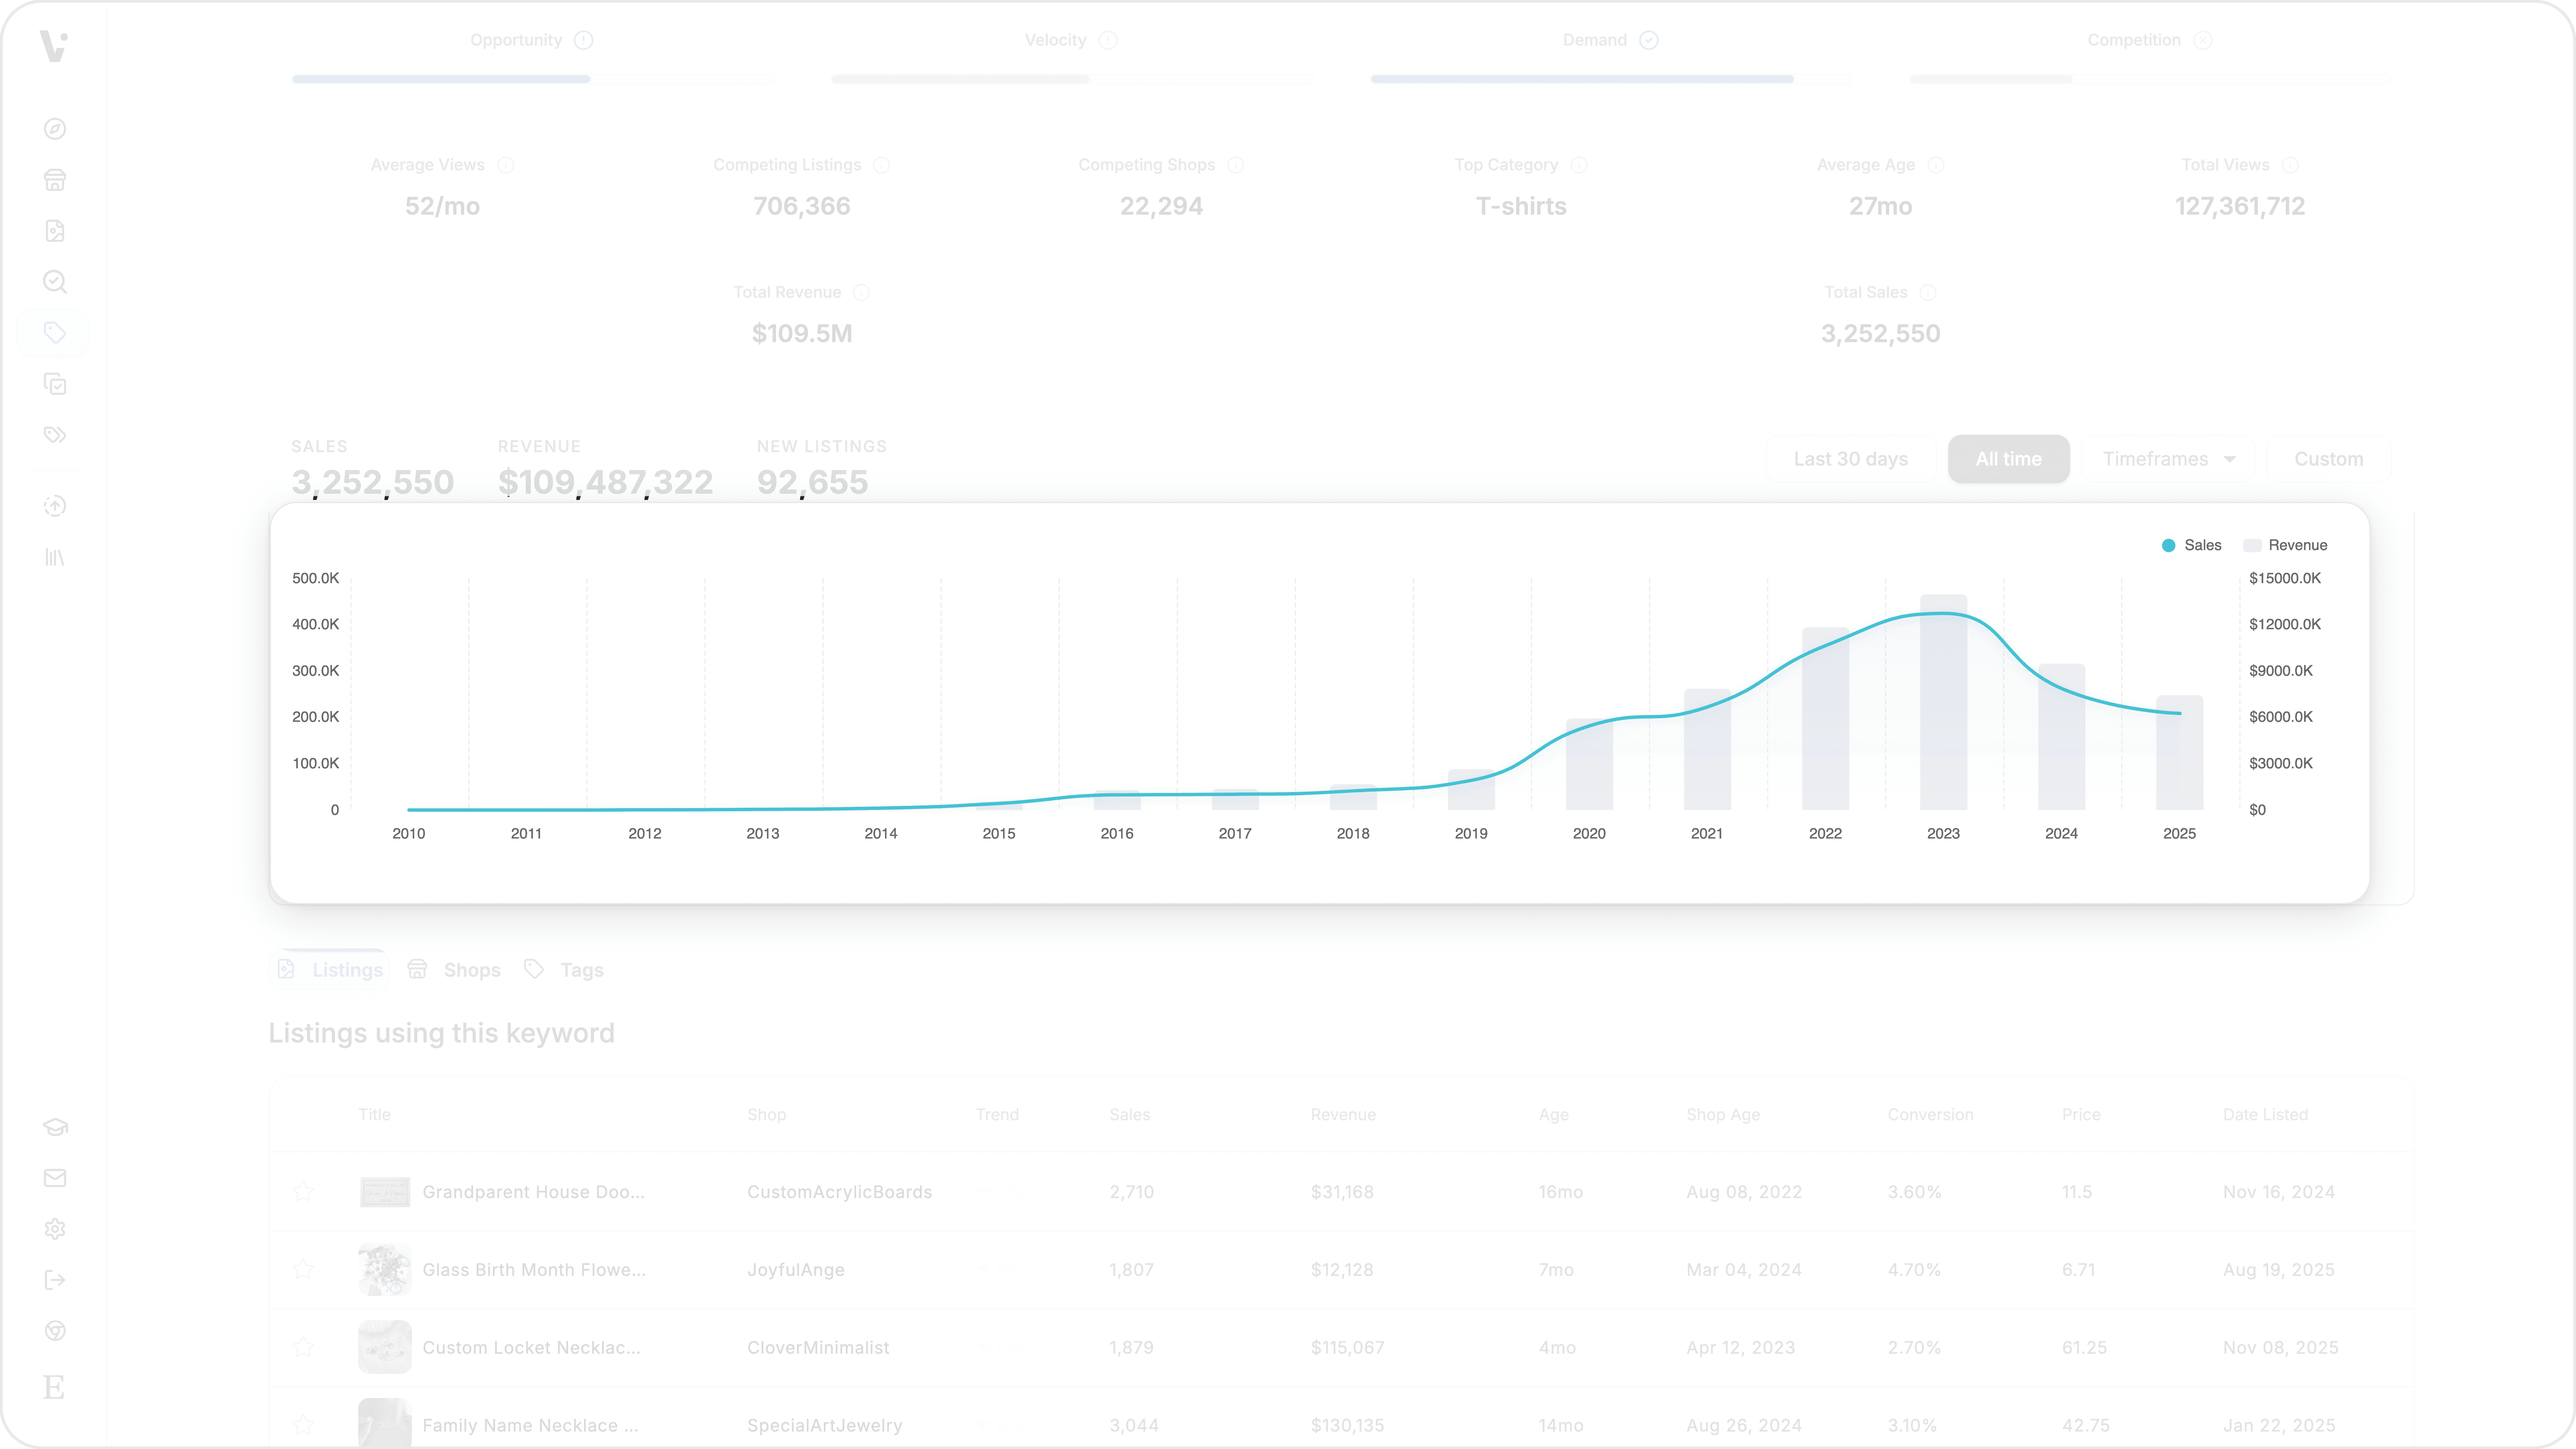
Evaluate any Etsy tag's market potential before adding it to your listings. Tag Analyzer shows you four proprietary scores — Opportunity, Demand, Competition, and Velocity — along with aggregate marketplace data, top-performing listings, competing shops, and related tags, all in one view.
What you can do with Tag Analyzer
Search any tag and see its Opportunity, Demand, Competition, and Velocity scores
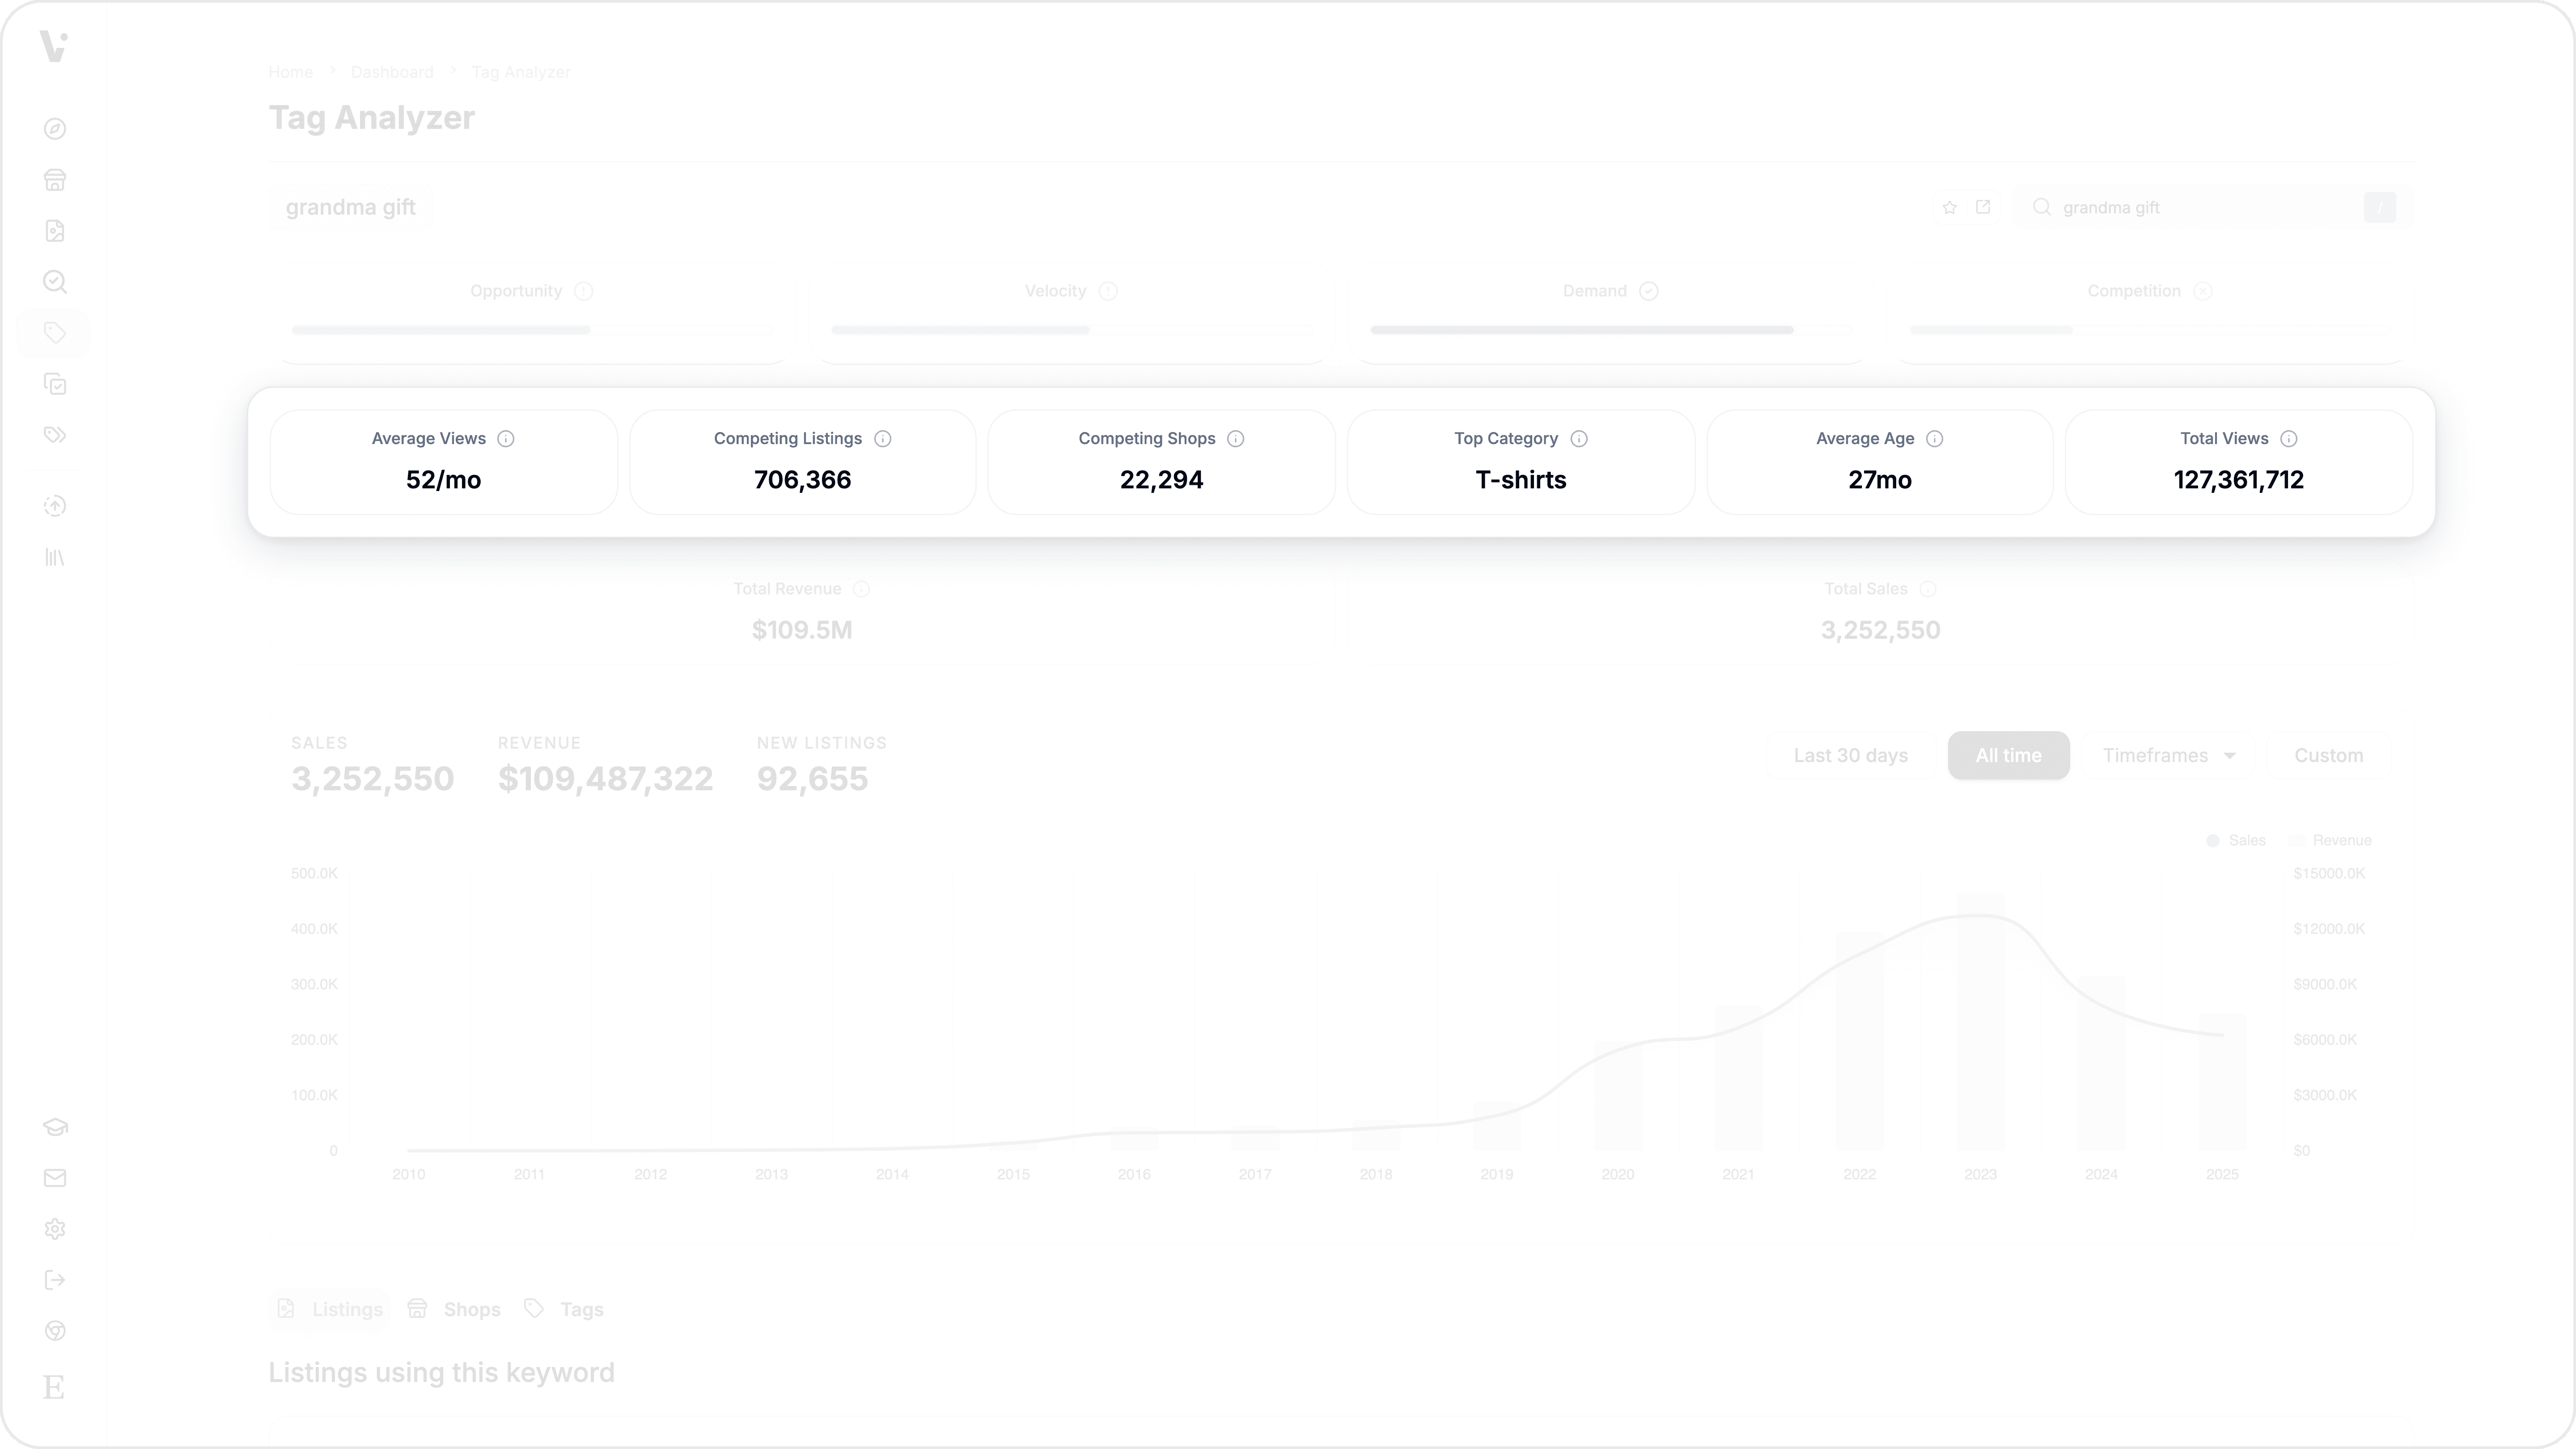
View aggregate metrics including total sales, revenue, views, competing listings, competing shops, and top categories
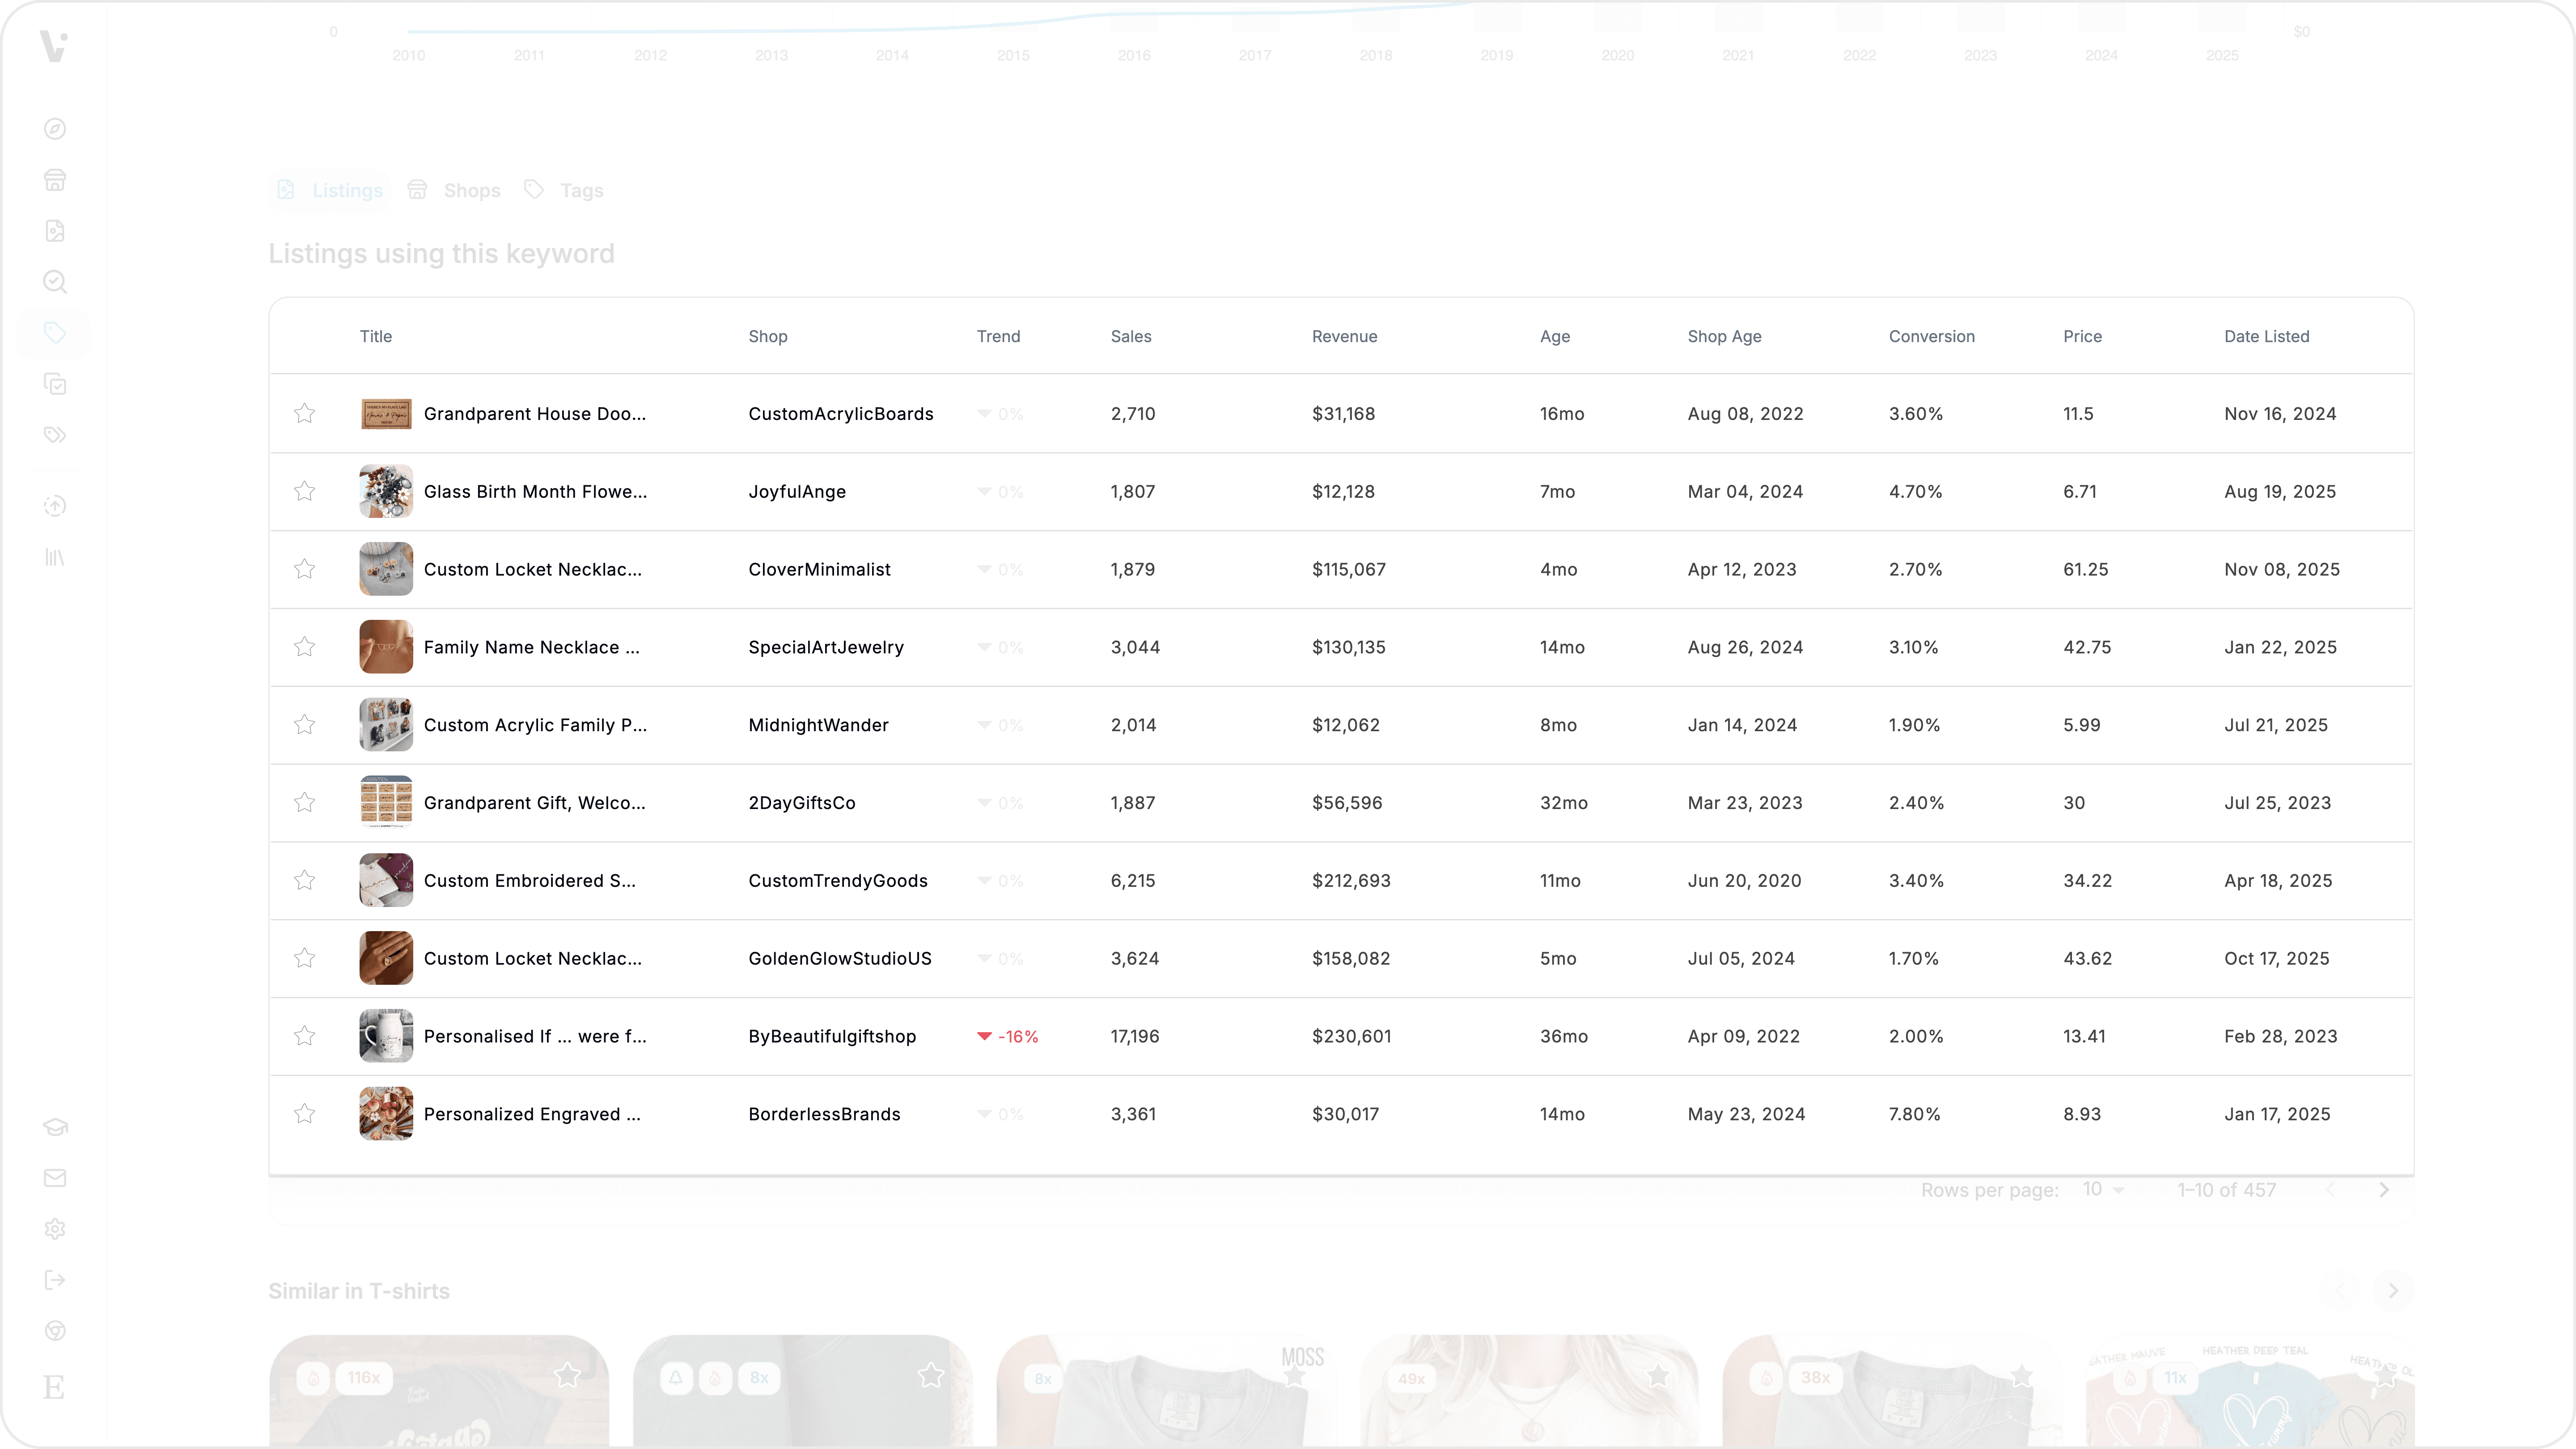
Browse the top-performing listings that use the tag, sortable by sales, revenue, views, and more
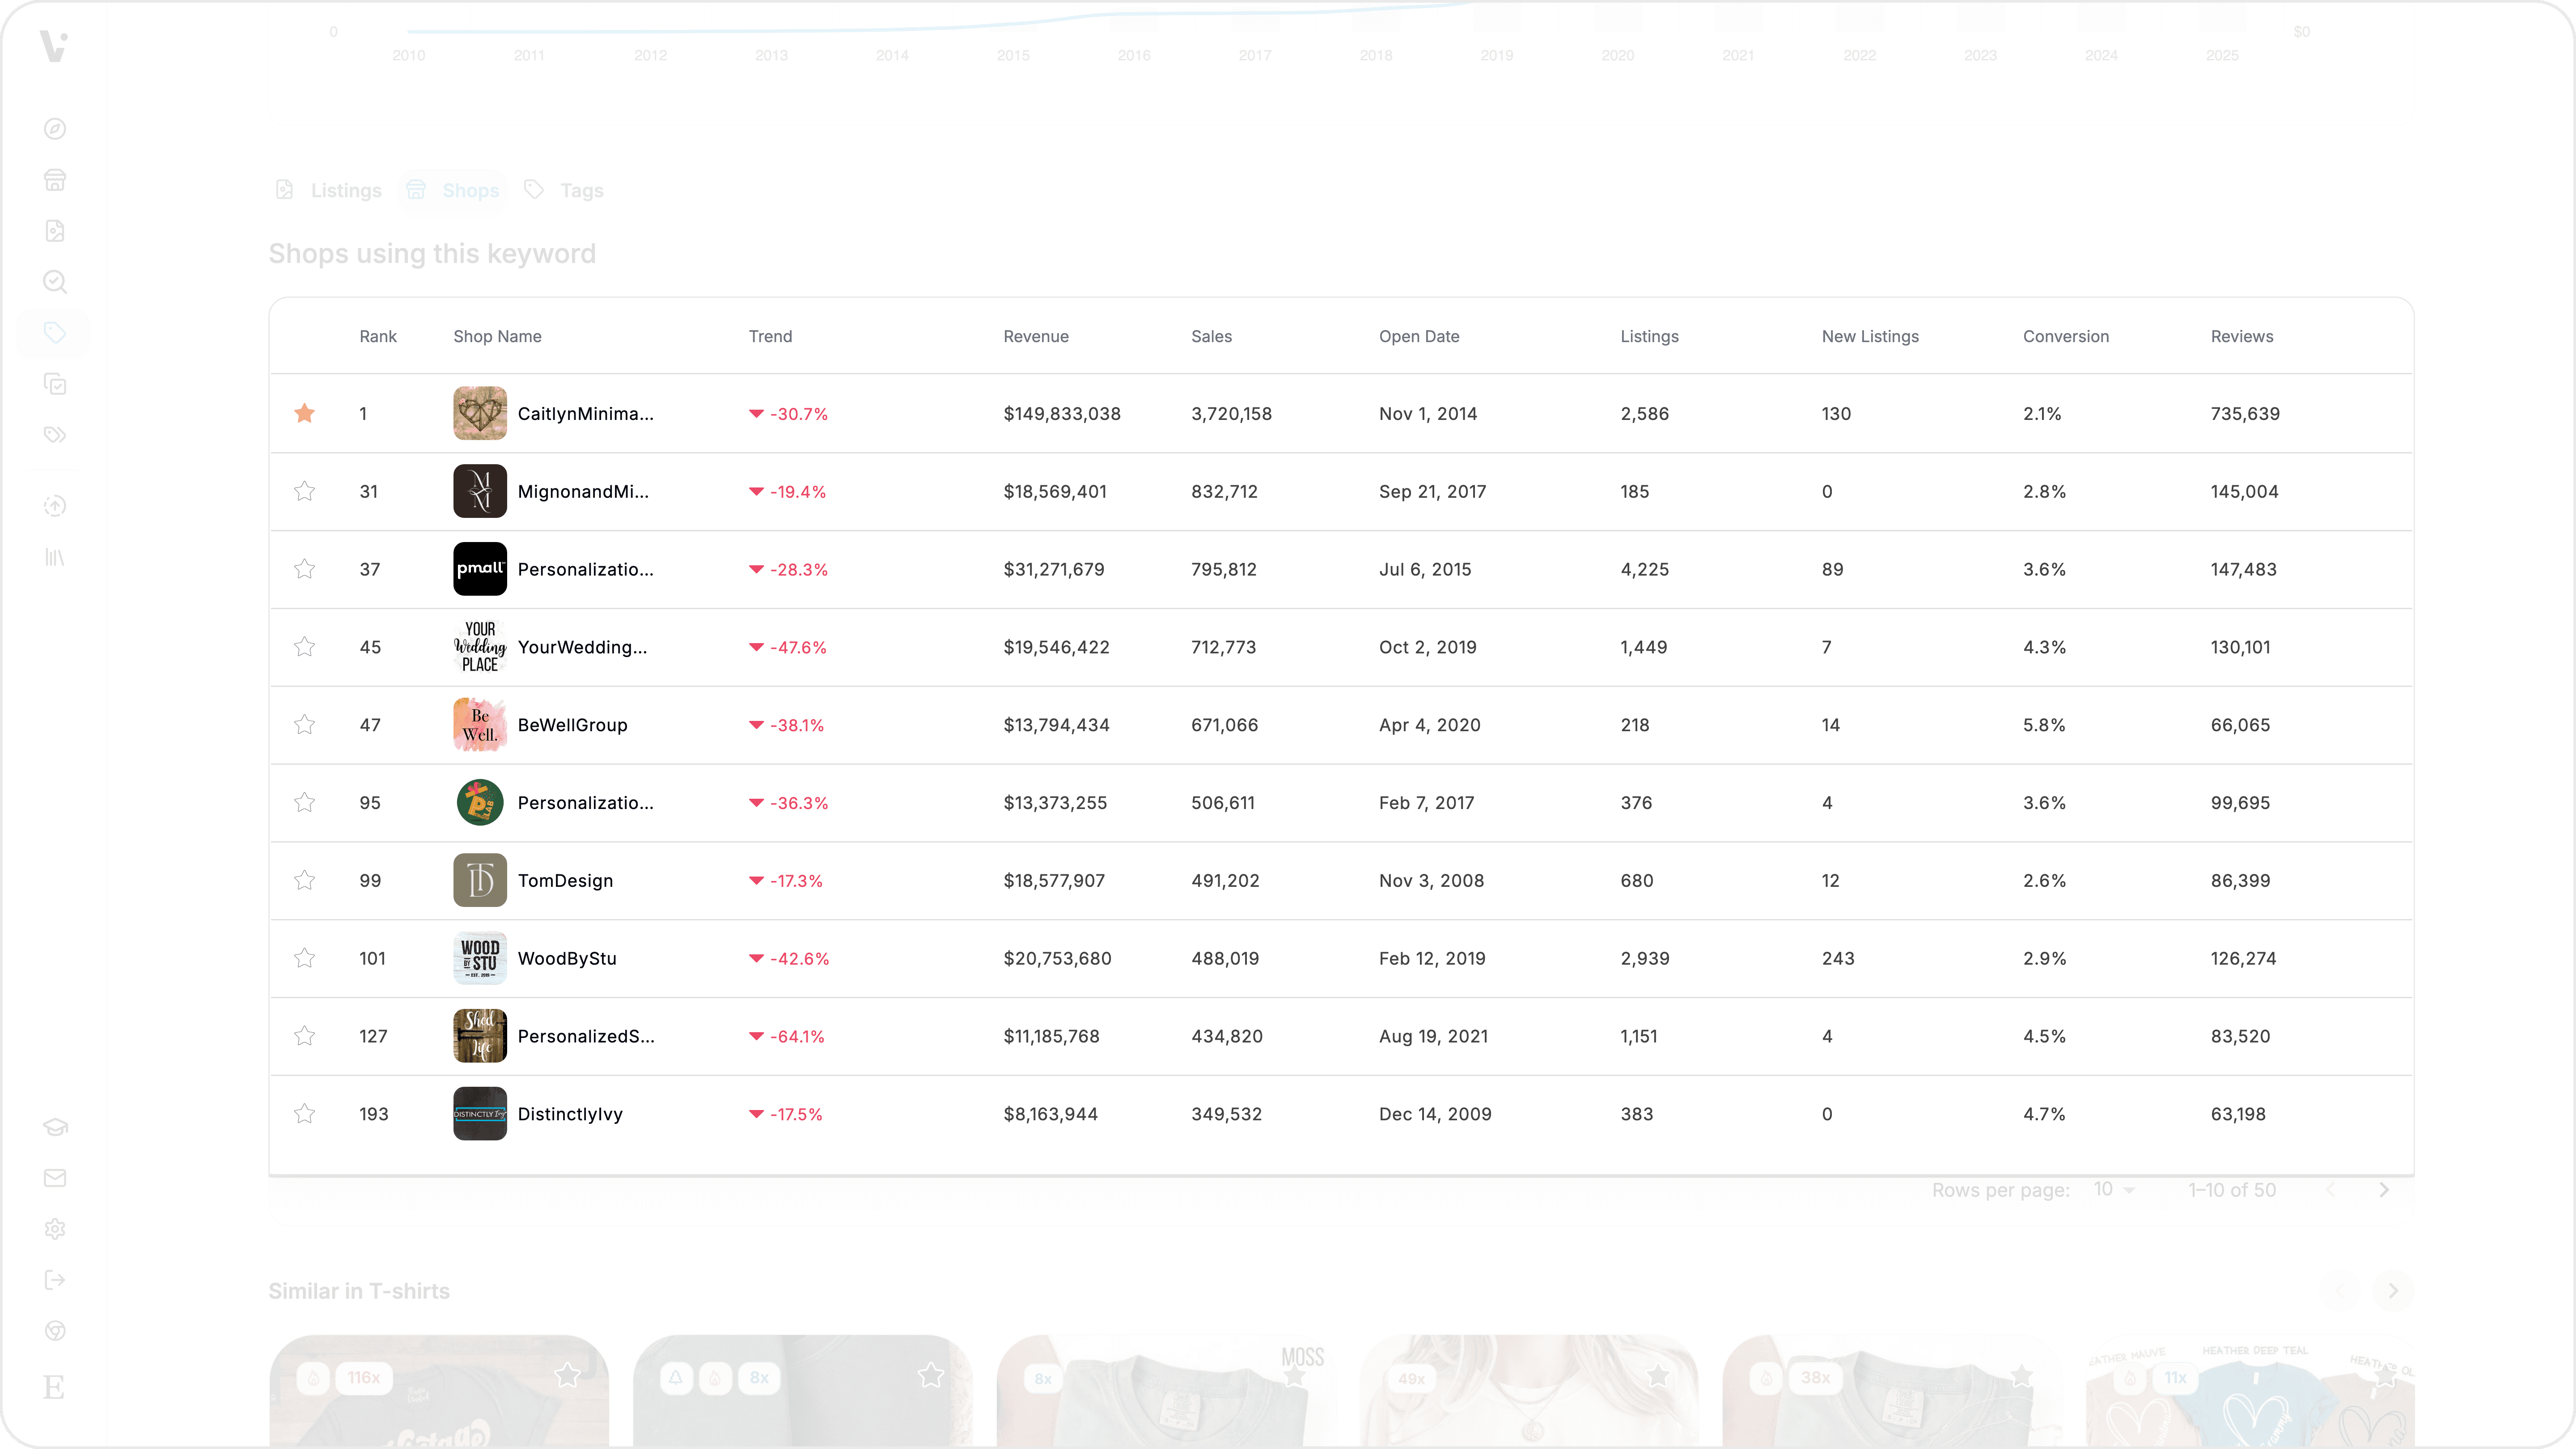
See which shops compete for the tag and how they perform
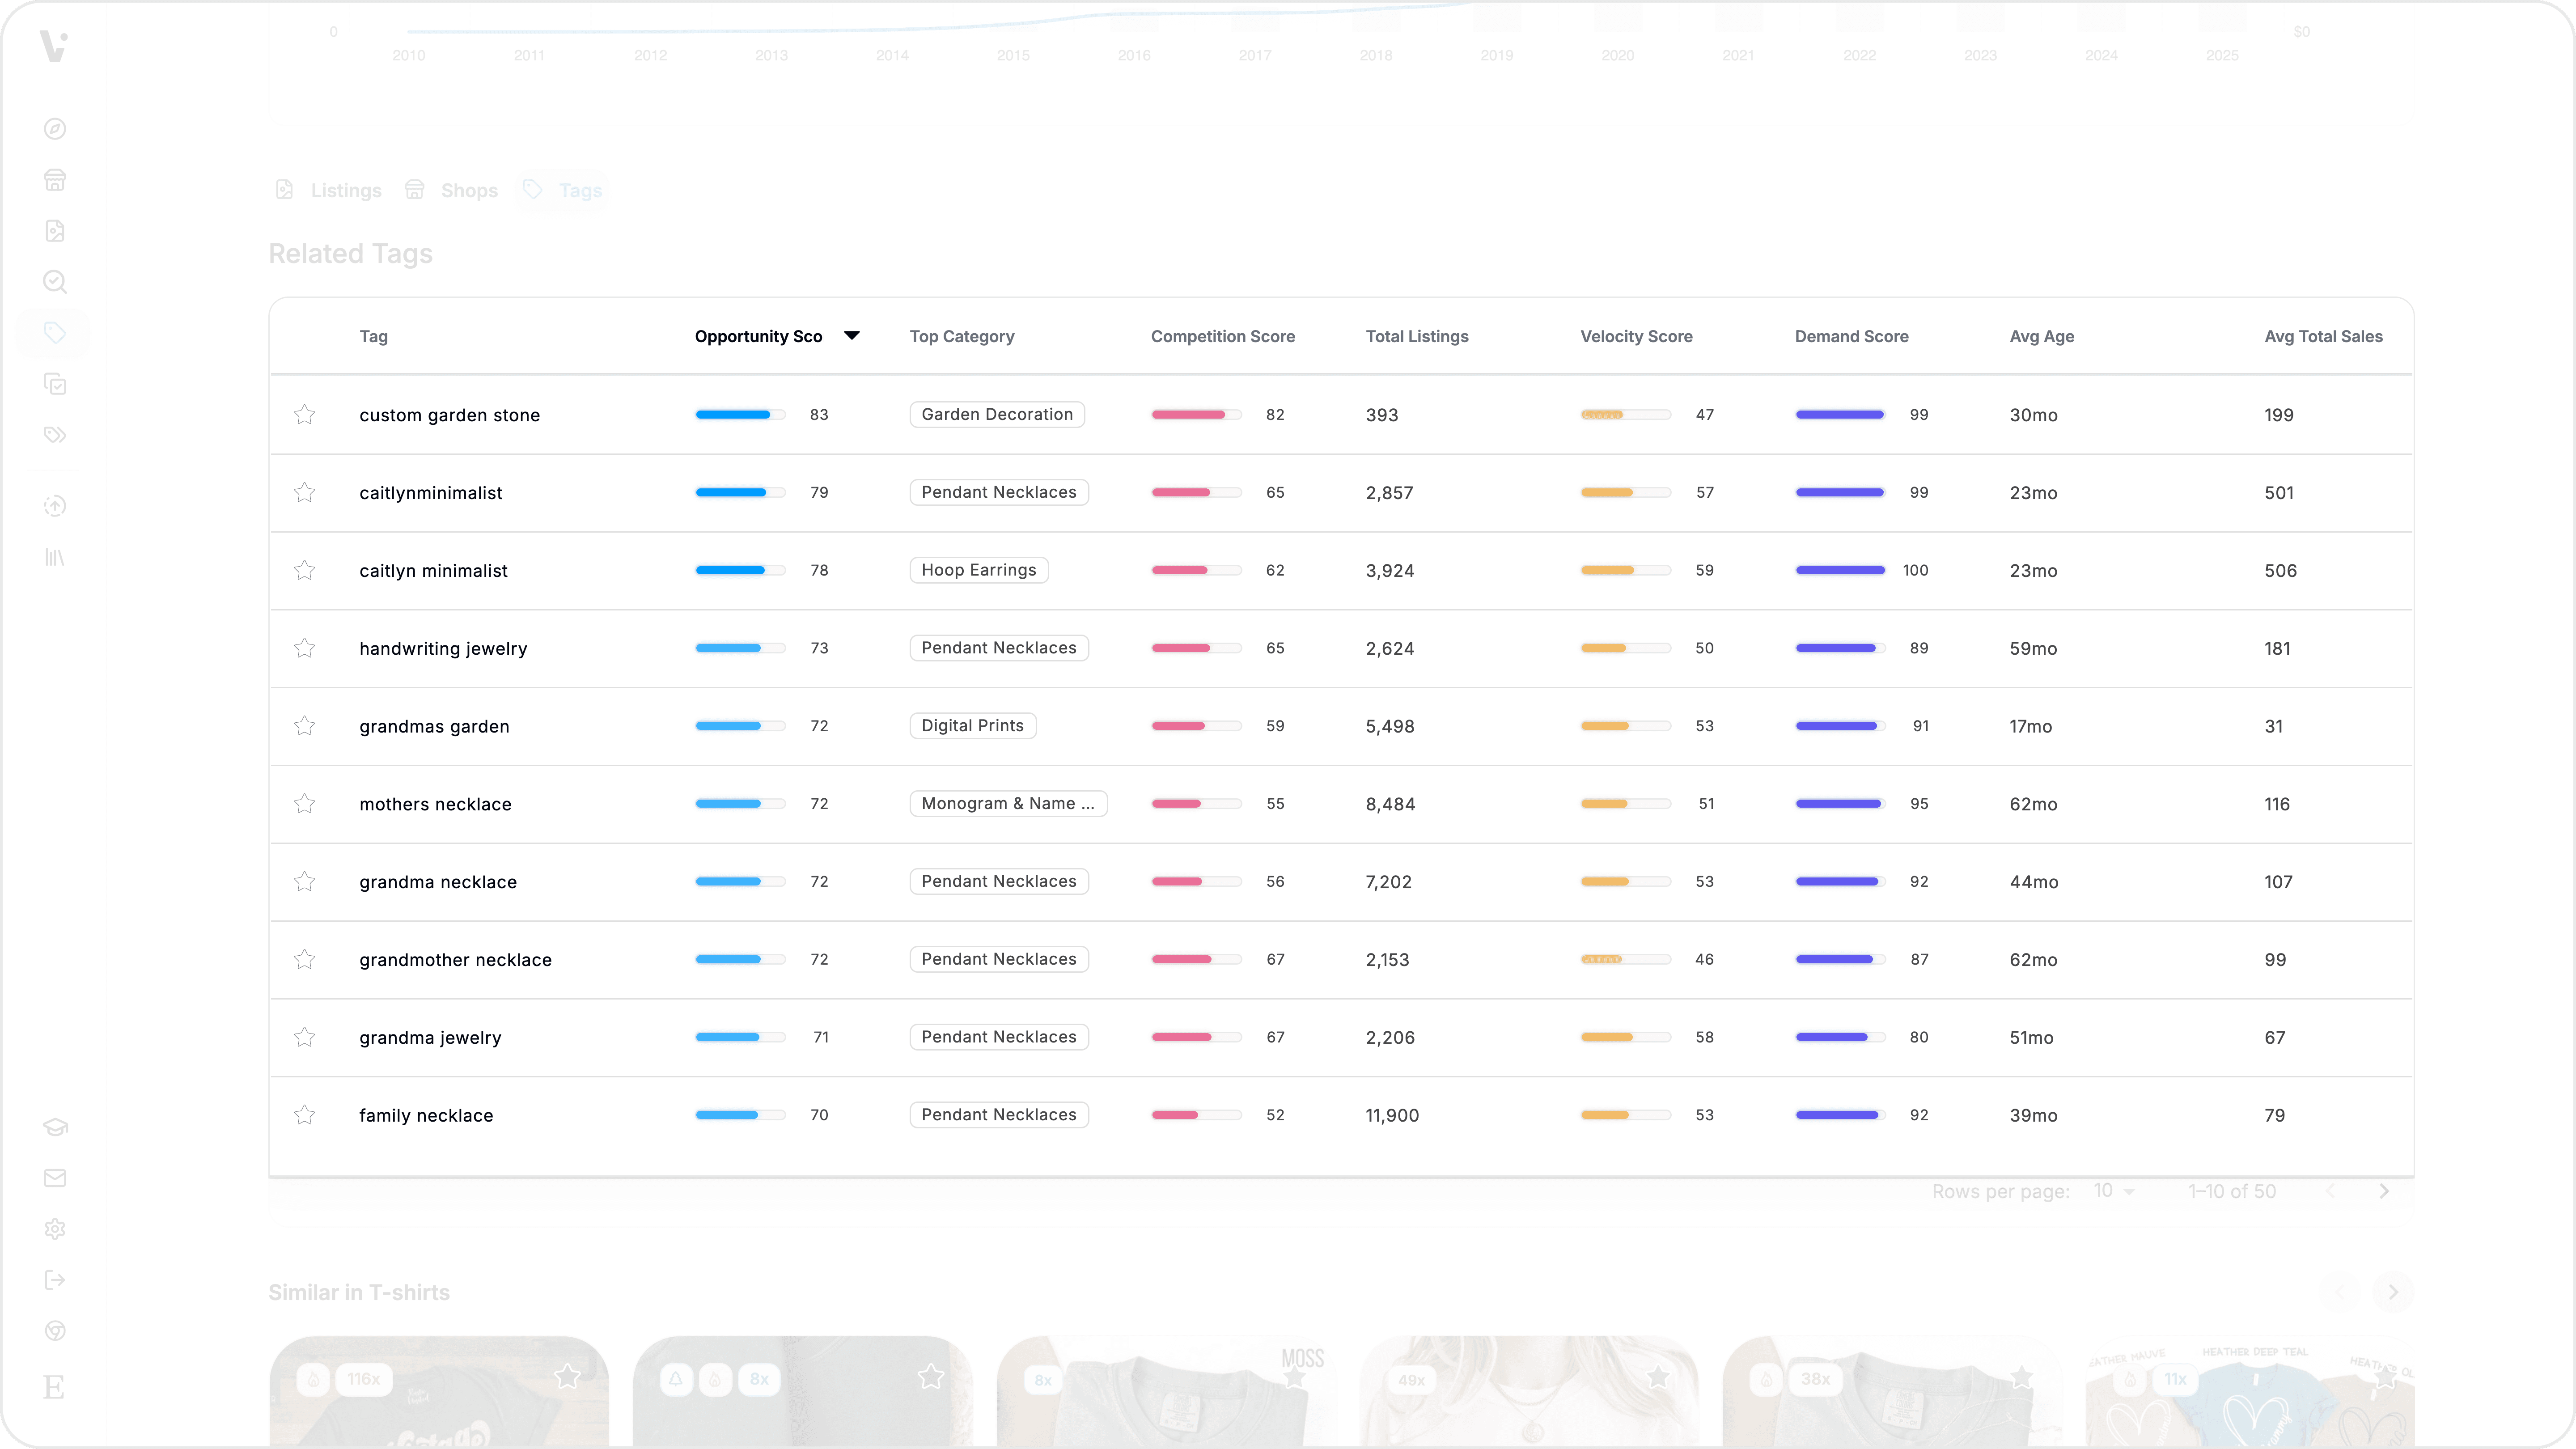
Discover related tags that co-occur with your searched tag
View sales and revenue trends over time with an analytics chart
Save listings, shops, or tags to your watchlist for tracking
Deep-link to any tag search using a URL parameter
How to use Tag Analyzer
Open Tag Analyzer — Navigate to Tag Analyzer from the main menu. You can also deep-link directly to a tag by adding
?tag=your+tagto the URL.Search for a tag — Type a tag in the search bar. Autocomplete suggestions appear as you type, drawn from popular tags, your recent searches, and marketplace suggestions. Select a suggestion or press Enter to search.
Review the score cards — Four score cards appear at the top of the results, each rated 0 to 100:
Opportunity Score — Overall tag potential (higher is better)
Demand Score — How much buyer interest the tag attracts
Competition Score — How uncrowded the tag is (higher means less competition)
Velocity Score — How quickly listings with this tag are selling relative to their historical average
Review the data cards — Below the scores, data cards show aggregate metrics: average views, competing listings, competing shops, top category, average listing age, total views, total revenue, and total sales.
Explore the tabs — Three tabs let you dig deeper:
Listings — Top-performing listings using this tag, with sortable columns for monthly sales, revenue, views, and more. Click any listing to open it in Listing Explorer.
Shops — Top shops competing for the tag, sortable by total sales, revenue, and other metrics.
Tags — Related tags that co-occur with your searched tag, each with its own scores. Click the search icon next to any tag to analyze it.
Check the analytics chart — View sales and revenue trends over time. Switch between timeframes (last month, 3 months, 6 months, all time) to spot seasonal patterns or growth trends.
Switch between tabs — Click the Shops or Tags tab to explore competing shops and related tags. Each tab has its own sortable data grid.
Discover related tags — The Tags tab shows tags that frequently co-occur with your searched tag, each with its own Opportunity, Demand, Competition, and Velocity scores. Click the search icon to analyze any related tag.
Browse recommended listings — Scroll to the bottom to see carousel sections of similar listings grouped by category. These help you discover how other sellers approach the same market.

Save to watchlist — Click the star icon next to any listing, shop, or tag to add it to your watchlist. Organize saved items into folders for ongoing tracking.
Key concepts
Opportunity Score — A composite score (0–100) that combines demand, competition, and velocity to identify how promising a tag is overall. It weights demand at 45%, competition at 35%, and velocity at 20%. A higher Opportunity Score means the tag offers a strong balance of buyer interest, low saturation, and recent sales momentum.
Demand Score — A percentile-based score (0–100) reflecting how much buyer interest a tag attracts, calculated from recent sales per listing. A tag in the 90th percentile for demand means it drives more sales per listing than 90% of all other tags.
Competition Score — A score (0–100) measuring how uncrowded a tag is. It uses a logarithmic scale based on the number of competing listings. A higher score means fewer sellers are competing for the tag, leaving more room for your listings to rank.
Velocity Score — A percentile-based score (0–100) showing how fast a tag is selling compared to its own recent history. It compares the last 30 days of sales to the 120-day monthly average. A score above 50 indicates the tag is accelerating; below 50 suggests it is slowing down.
Tips & best practices
Use the Opportunity Score as your primary filter for tag decisions. It combines the other three scores into a single, actionable number that reflects how worthwhile a tag is for your listings.
Compare scores across several candidate tags before choosing. A tag with high demand but low competition is often more valuable than one with high demand and high competition.
Check the Velocity Score to spot seasonal or trending tags. A rising velocity indicates growing buyer interest — useful for timing new listings or promotions.
Explore the Related Tags tab to find adjacent opportunities. Tags that co-occur with your main tag often share buyer intent and can help you fill all 13 of your tag slots with relevant options.
Use the analytics chart to understand whether a tag's performance is stable, seasonal, or declining. Steady trends suggest reliable long-term value; spikes may indicate temporary trends.
Common questions
What does it mean if a tag is not found?
Tag Analyzer draws from a database of tags used across millions of Etsy listings. If a tag is not found, it means no listings in the database use that exact tag. Try a more common variation or a broader term.
How often is the data updated?
Tag scores and aggregate metrics are refreshed periodically through a batch pipeline. The competing listings count is updated from Etsy's live API at most once every 30 days. For the most current snapshot, check the analytics chart timeframes.
What is the difference between Tag Analyzer and Keyword Finder?
Tag Analyzer evaluates specific tags (the terms sellers add to their listings) and scores them with proprietary metrics. Keyword Finder analyzes broader search terms that buyers type into Etsy's search bar, with data on search volume and pricing distribution. Both are valuable — Tag Analyzer helps you pick your 13 tags, while Keyword Finder helps you understand what buyers are searching for.
Can I analyze tags from a competitor's listing?
Yes. Use Tag Extractor to see a competitor's tags, then search any of those tags in Tag Analyzer to evaluate their market potential before adding them to your own listings.
Do results load progressively?
Yes. Some data (like top listings, shops, and analytics) loads in the background after the initial scores appear. A progress indicator shows the loading status, and partial results display as they become available.
Need Help Getting Started?
Getting Started
Summarize