View Docs
Documentation
Database
Asset Library
Bulk Editor
Listing Explorer
Tag Analyzer
Shop Analyzer
Browser Extension
Print on Demand
Policies
Documentation
→
General
→
3 Tips to Get Started
Alek
3 Tips to Get Started
New to ListingView? Most sellers only scratch the surface of the dashboard when they first sign up. Here are three quick tips that'll help you unlock the full picture.
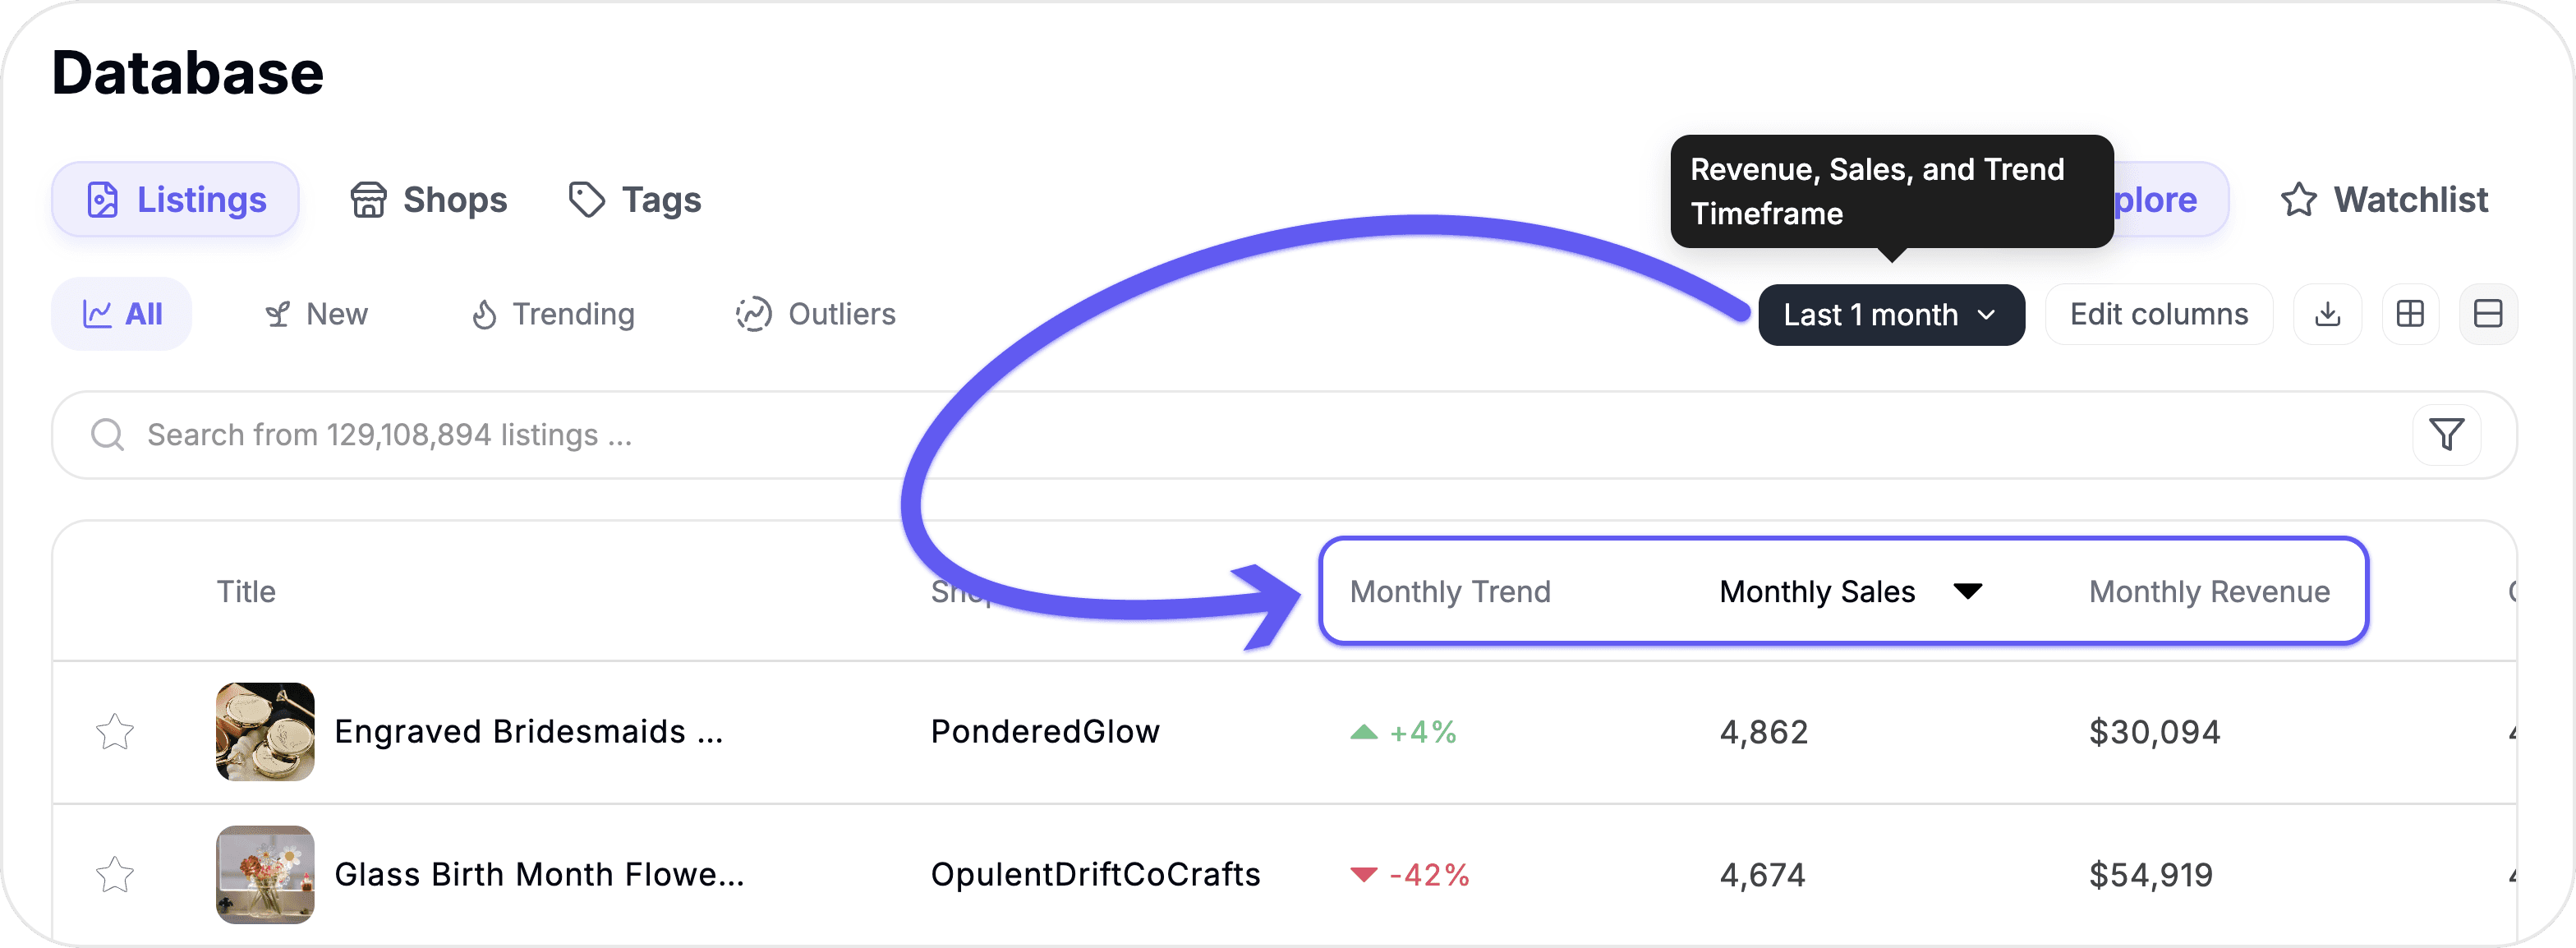
1. Change Your Sales Timeframe
By default, you're seeing a single snapshot of sales data — but there's a lot more to explore. Use the timeframe selector to toggle between 7 days, 1 month, 2 months, 6 months, 12 months, and all time. Your Sales, Revenue, and Trend columns update instantly.
This is one of the most powerful features on the dashboard. Want to find products that are trending right now? Switch to 7 days. Want to see what sells consistently year-round? Switch to 12 months or all time. Comparing timeframes is the fastest way to separate seasonal spikes from real, sustained demand.
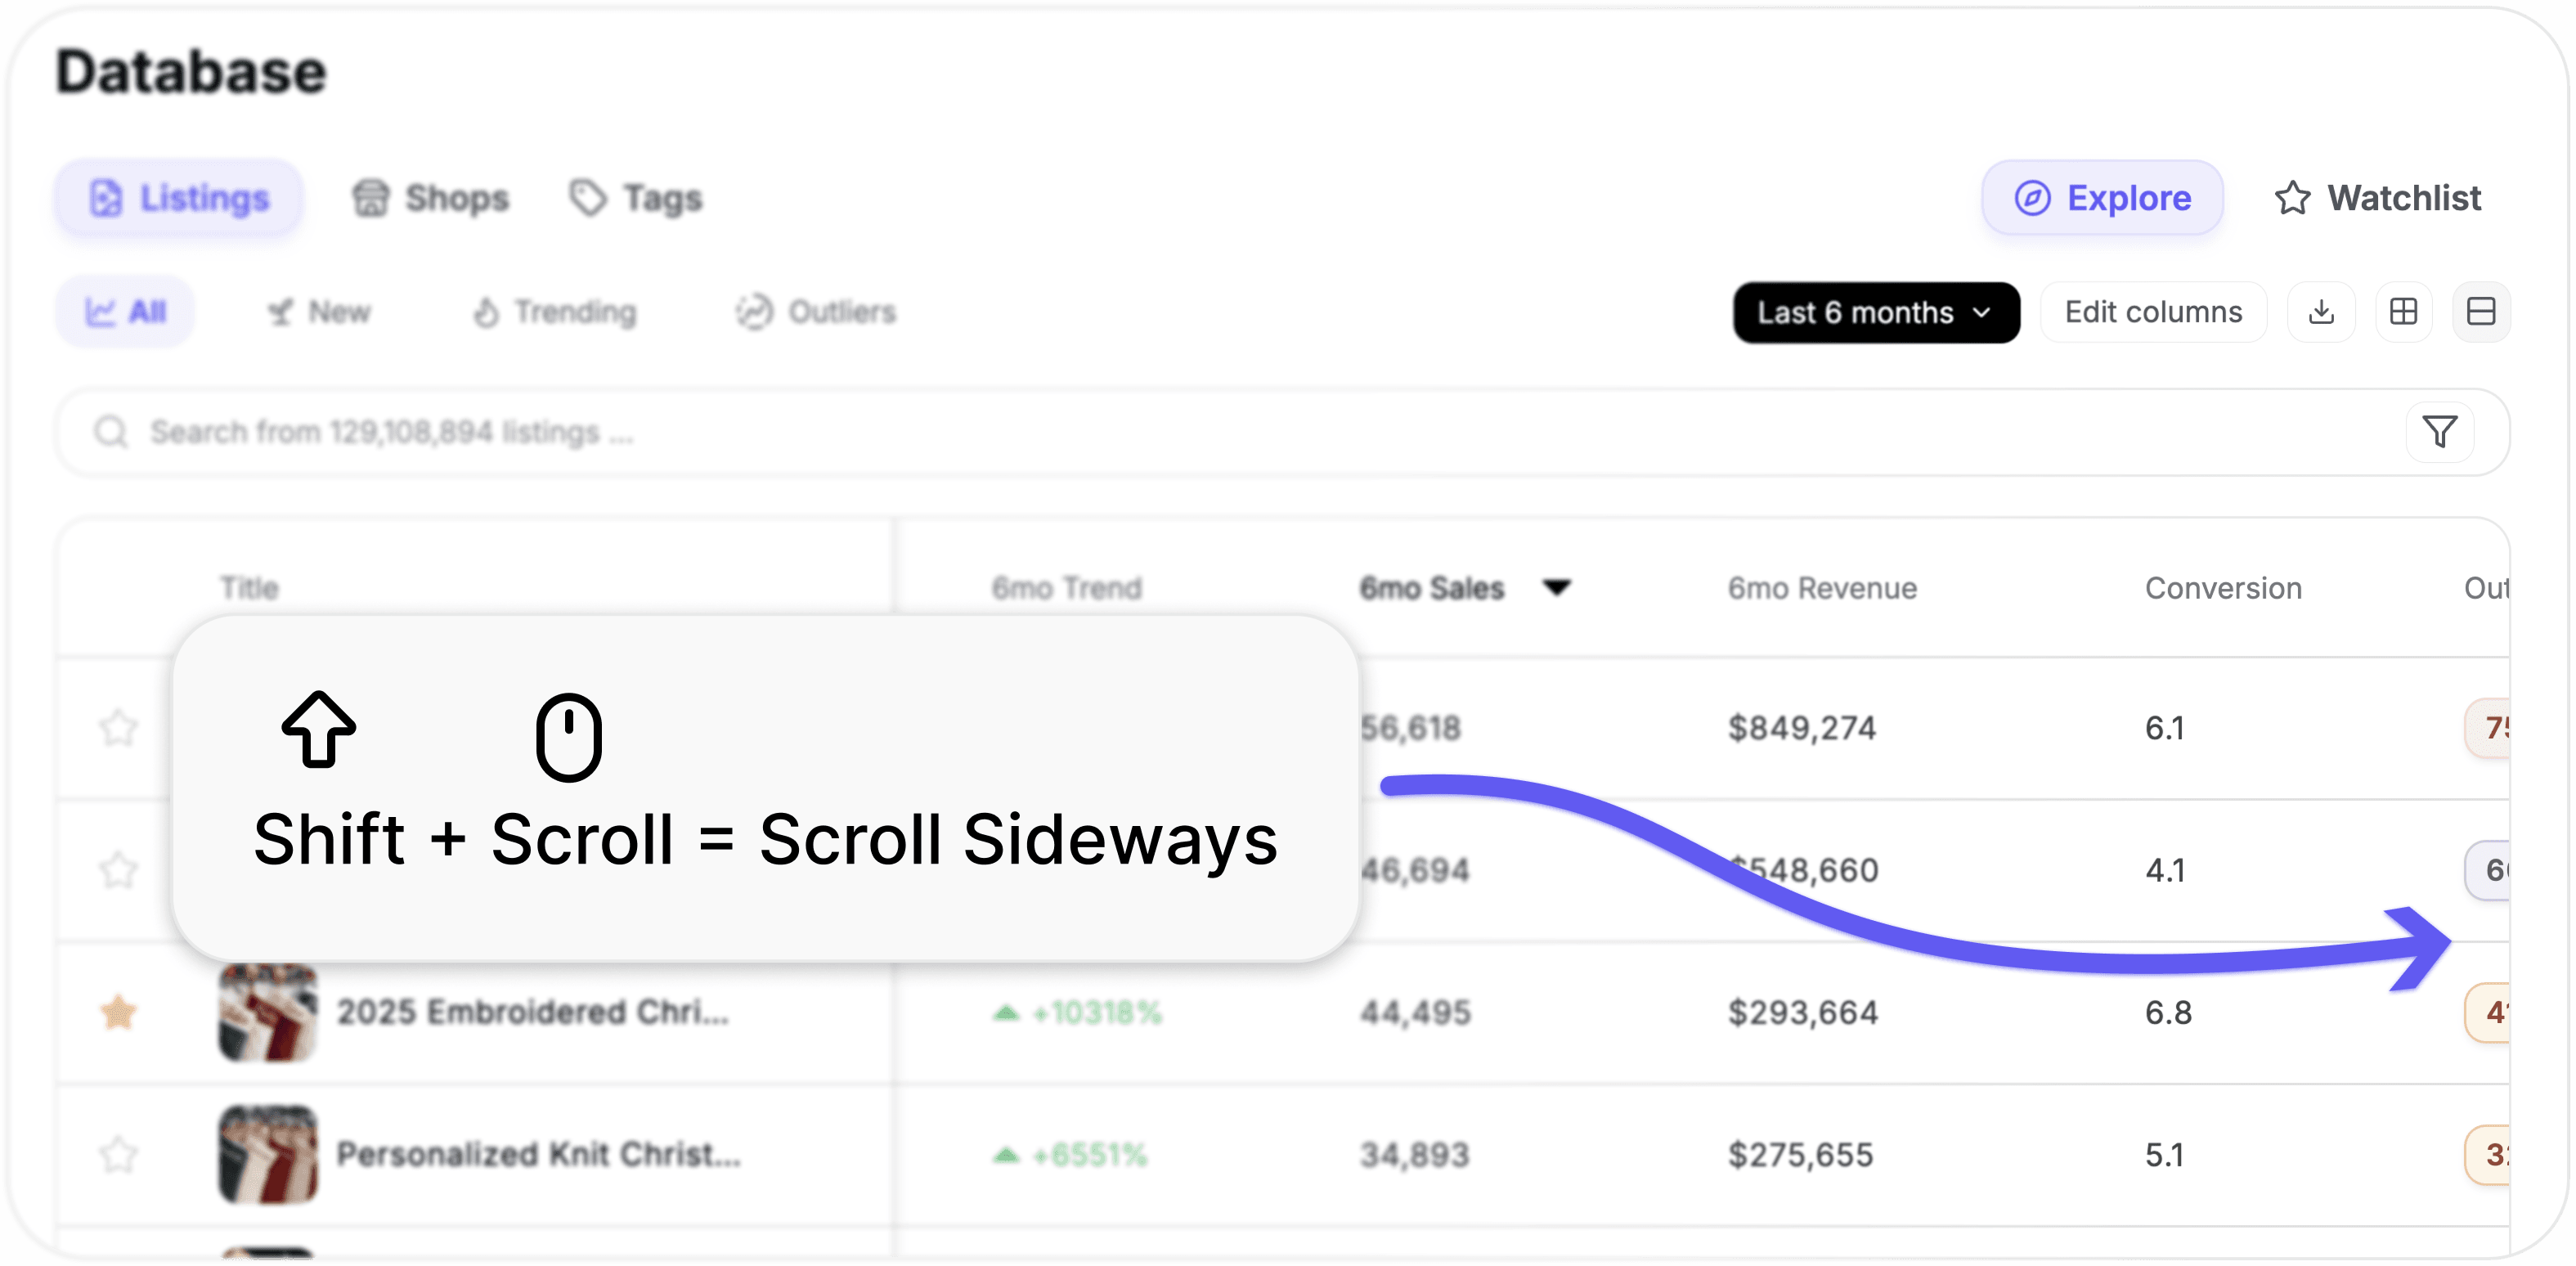
2. Scroll Sideways to See Every Column
If you've only been looking at the first few columns on the dashboard, you're missing out. There's a lot more data to the right — tags, categories, price history, and more.
To scroll horizontally, hold Shift and scroll with your mouse wheel. It's a small trick, but it opens up the full dataset so you can make more informed decisions without switching between pages.
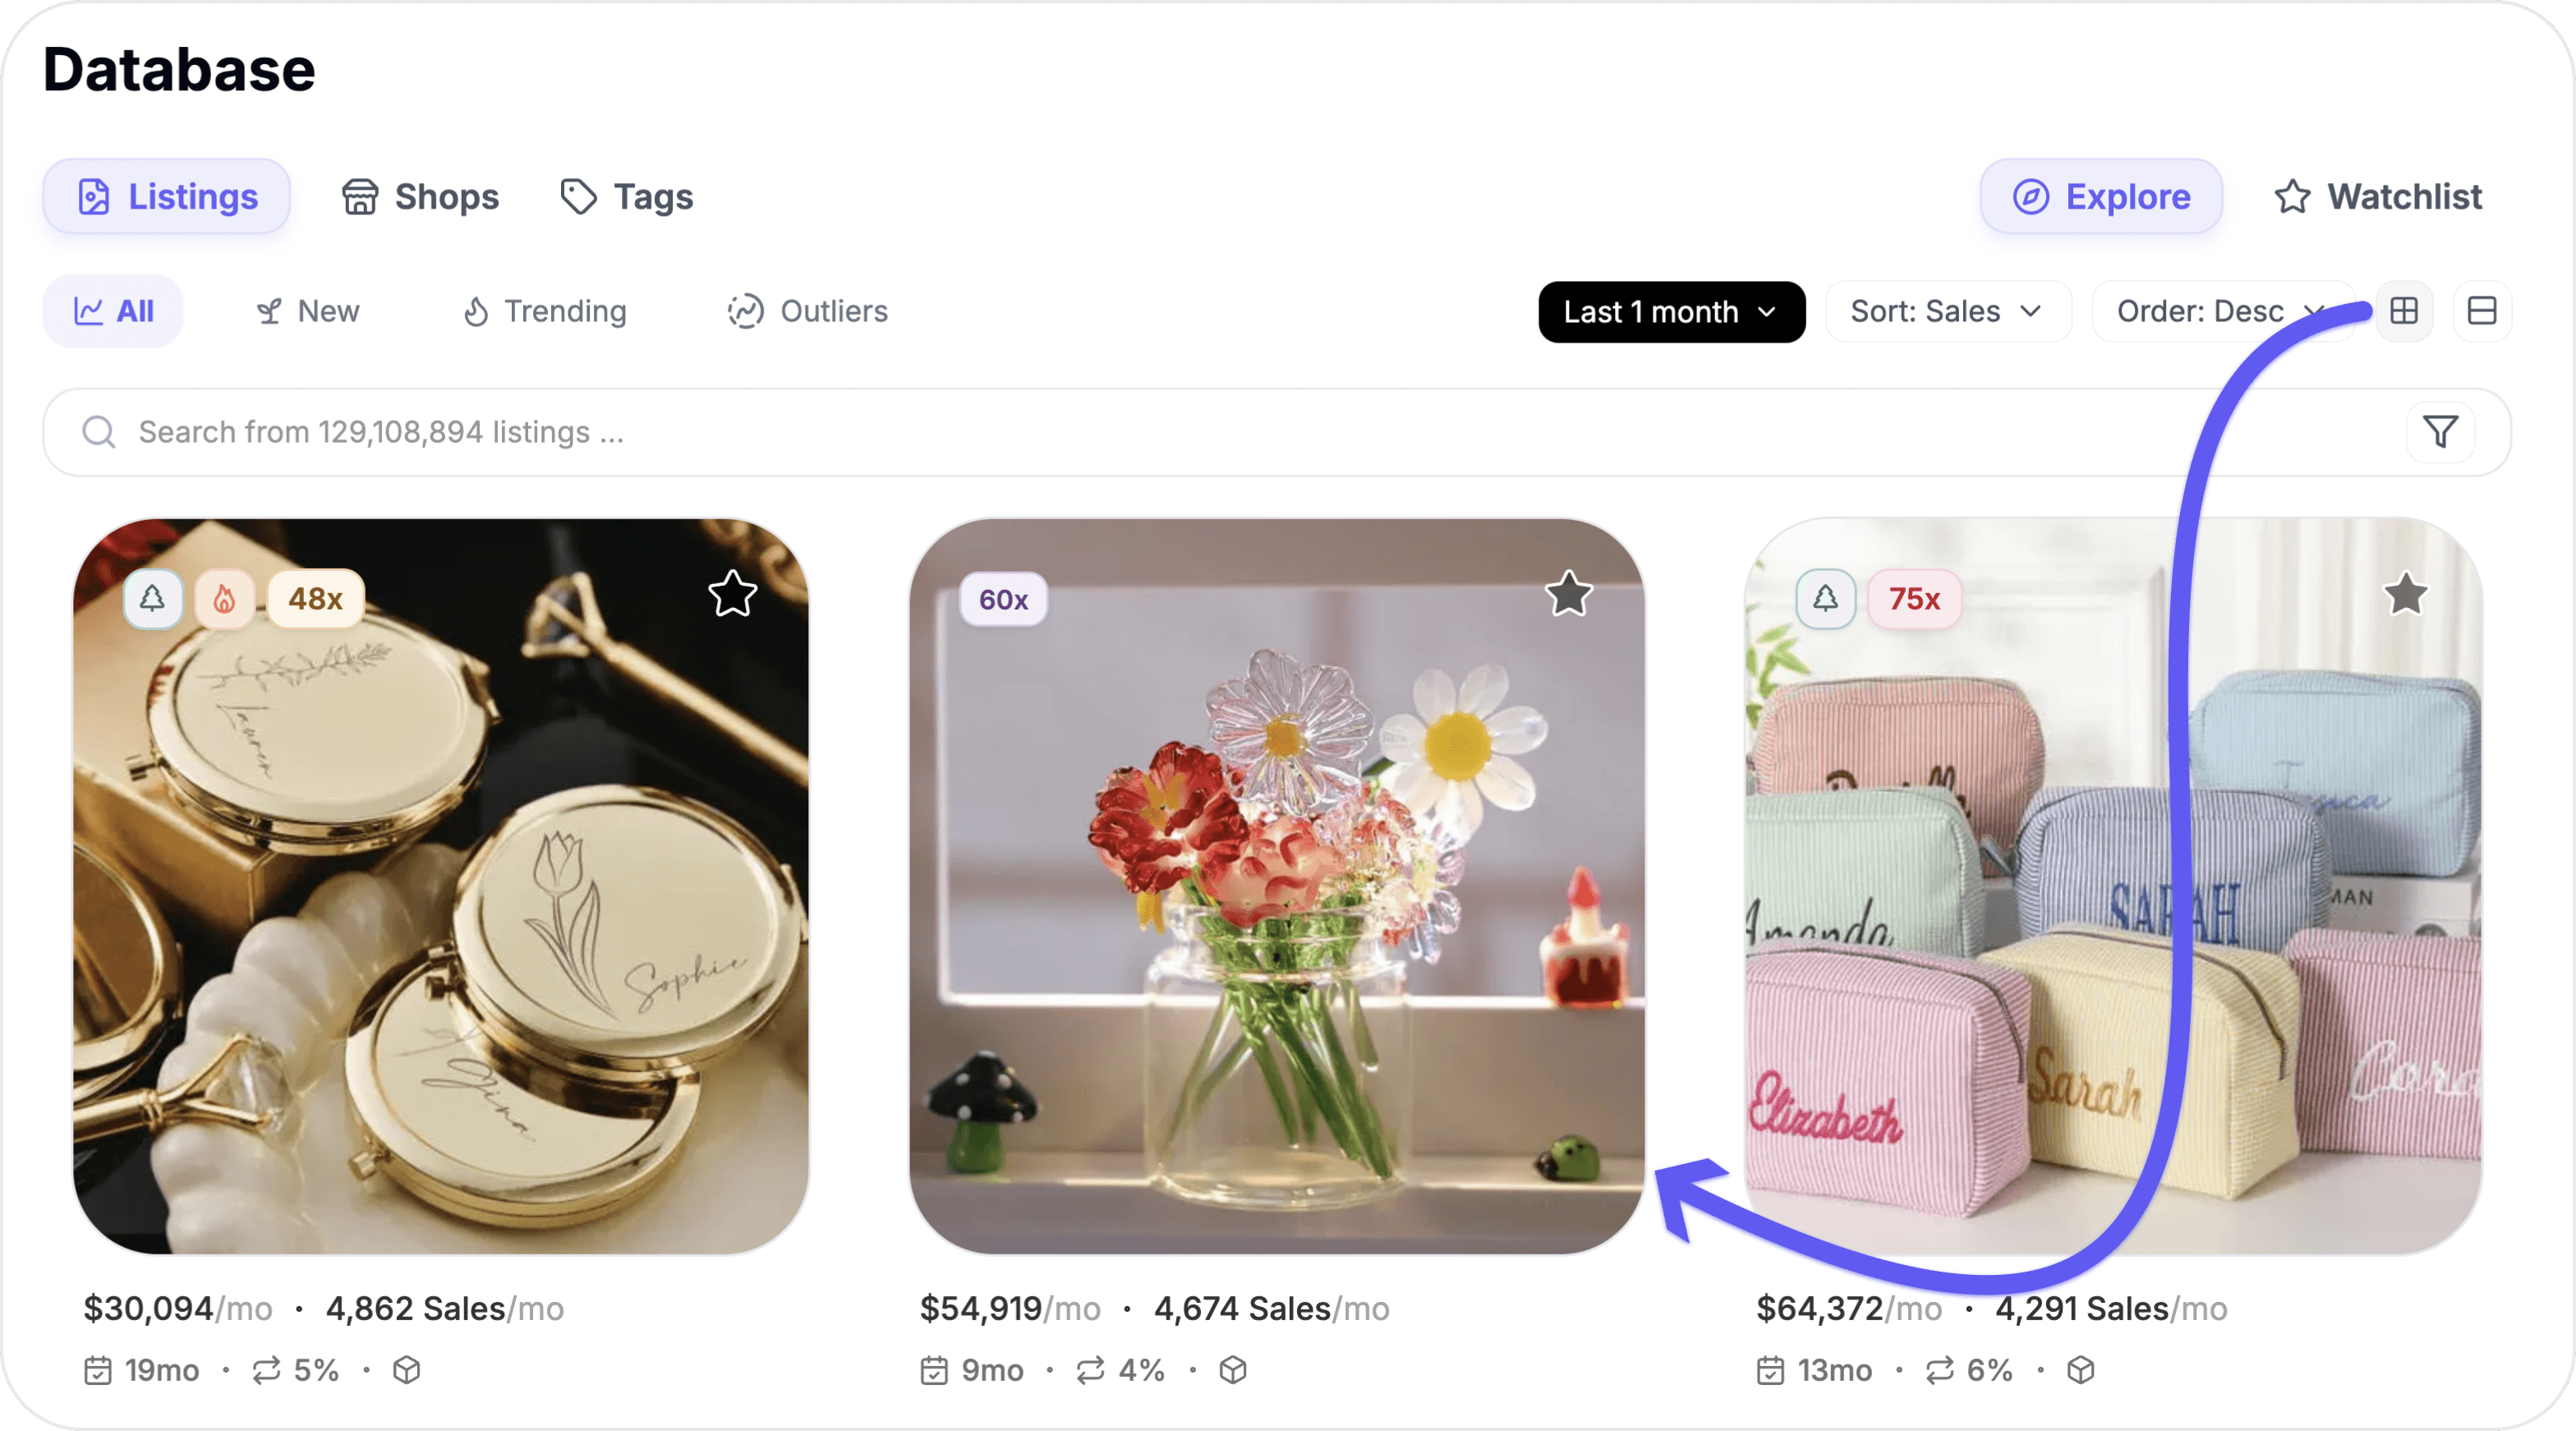
3. Toggle Between Table View and Grid View
Everyone processes information differently. That's why ListingView gives you two ways to browse your data:
Table view is ideal for comparing numbers across listings side by side.
Grid view gives you a more visual, card-style layout that makes it easier to scan through listings quickly.
Try both and see which one fits your workflow. You can switch between them at any time — there's no wrong answer here.
Start Exploring
These three small adjustments make a big difference in how you use the dashboard. If you have any questions, reach out to our team — we're always happy to help.
Summarize