
View Docs
Documentation
Database
Asset Library
Bulk Editor
Listing Explorer
Tag Analyzer
Shop Analyzer
Browser Extension
Print on Demand
Policies
Documentation
→
Listing Explorer
→
Listing Details
Alek
Listing Details
Listing Details
When you search a listing in Listing Explorer, you get a full performance breakdown across several sections — from sales metrics and SEO scoring to tag-level keyword analytics and the parent shop's performance. Here's what each section shows and how to use it.
Metric cards
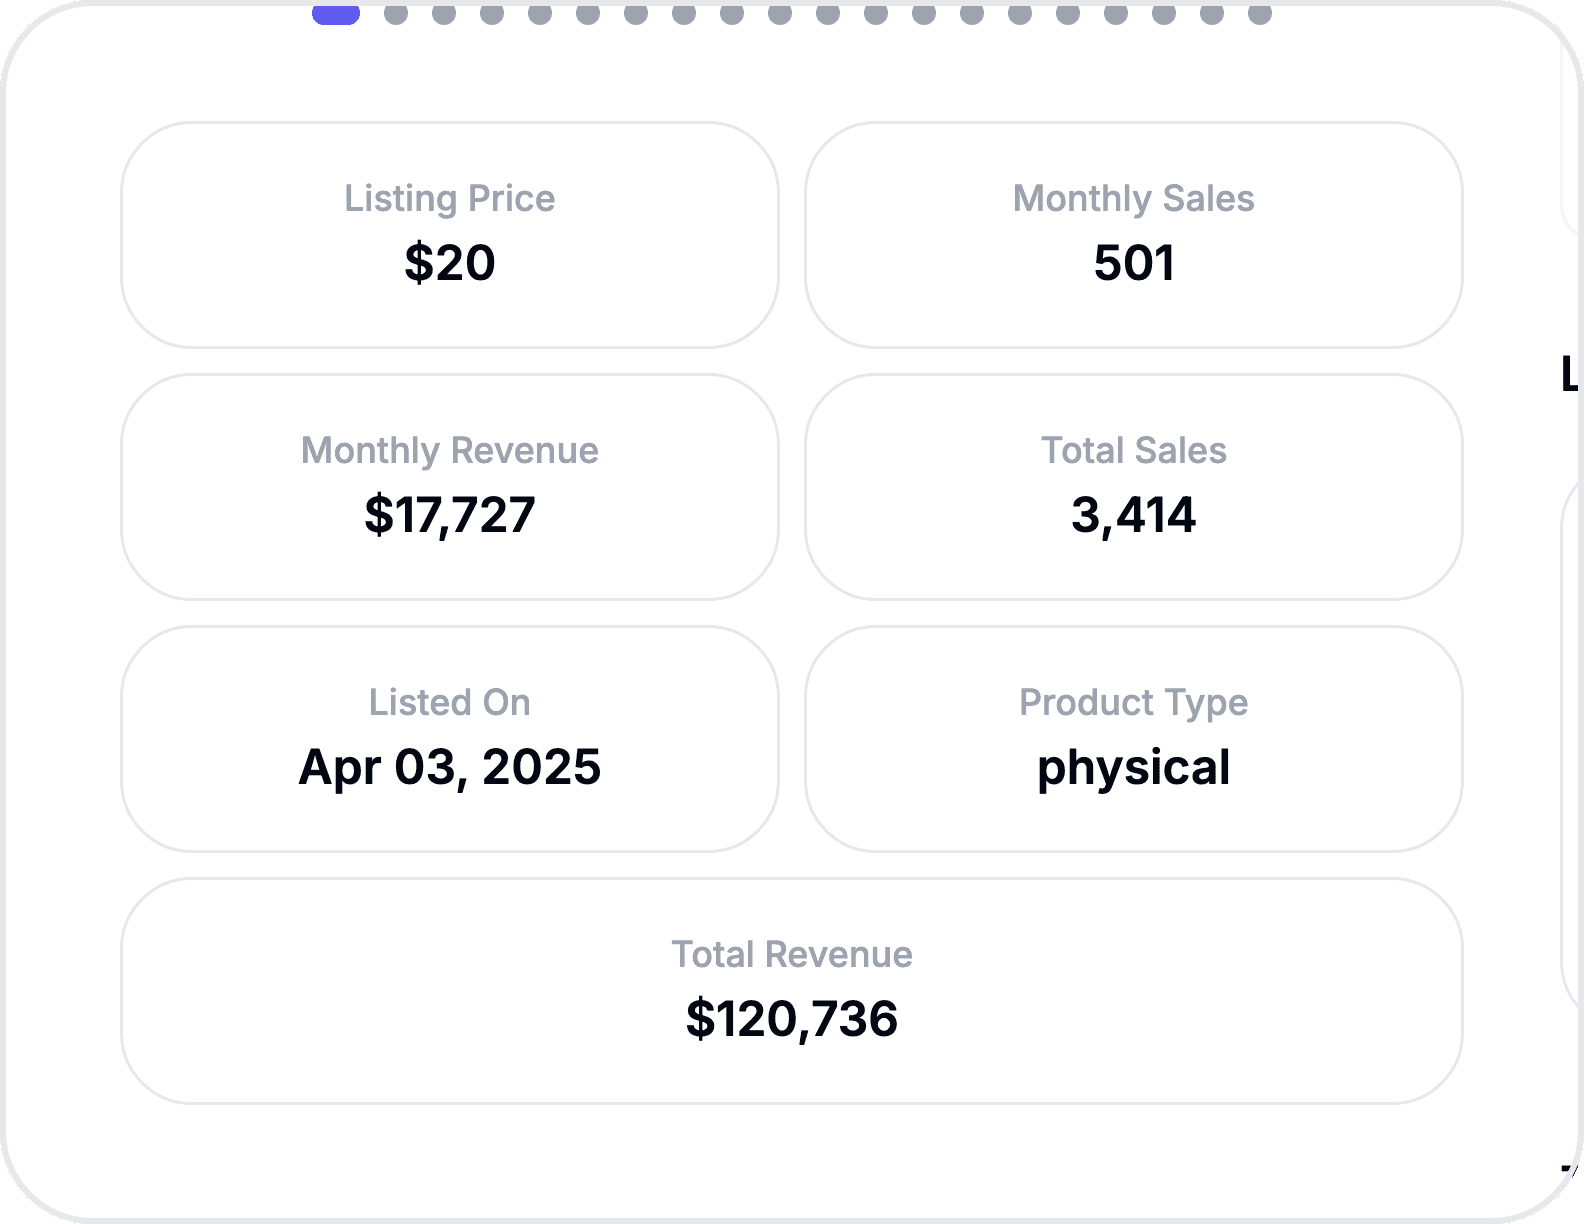
The left column displays seven metric cards with the listing's core performance data:
Metric | What it shows |
|---|---|
Listing Price | Current selling price |
Monthly Sales | Estimated sales for this month |
Monthly Revenue | Estimated revenue this month |
Total Sales | All-time sales count |
Total Revenue | All-time revenue earned |
Listed On | Date the listing was first published |
Product Type | Physical or digital |
Full details
Expand the Full Details accordion below the metric cards to see additional listing metadata grouped into categories:
Listing Status & Type — Status (available, unavailable, expired, vacation mode), listing type, category, date posted, auto-renew setting
Engagement & Social Proof — Favorites count, review count
Content & Optimization — Title character count, description character count, tags used (out of 13), shop placement
Customization — Personalization, maker info, production partner
Analytics chart
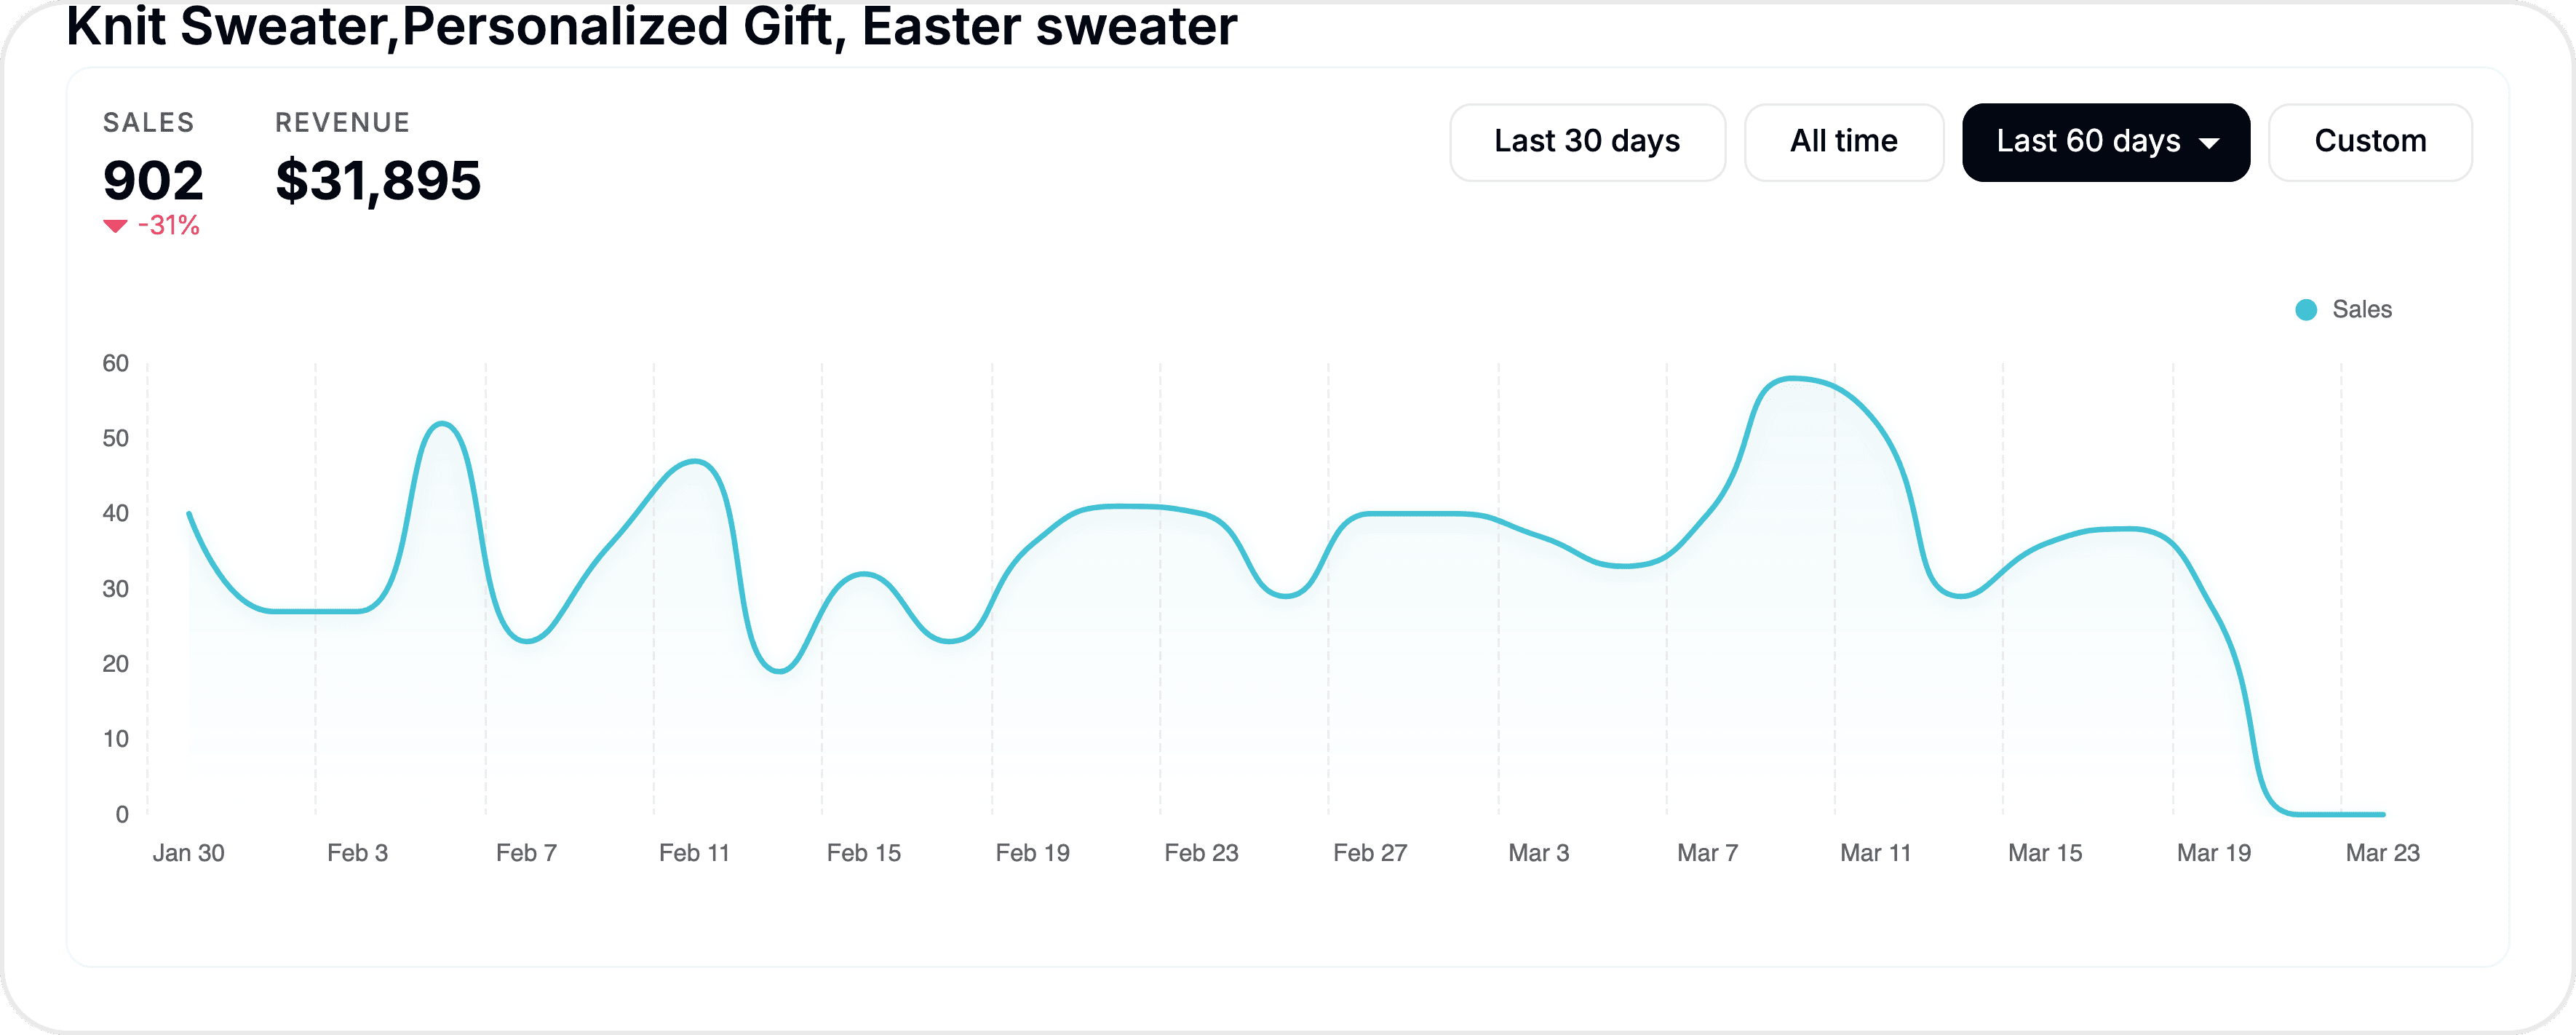
The time-series chart shows sales and revenue trends over time. Use the timeframe selector to switch between Last 30 days, Last 60 days, Last 3 months, Last 6 months, Last 12 months, This year, All time, or a custom date range.
If new data becomes available while you're viewing the page, a notification appears with an Update Data button.
SEO scores
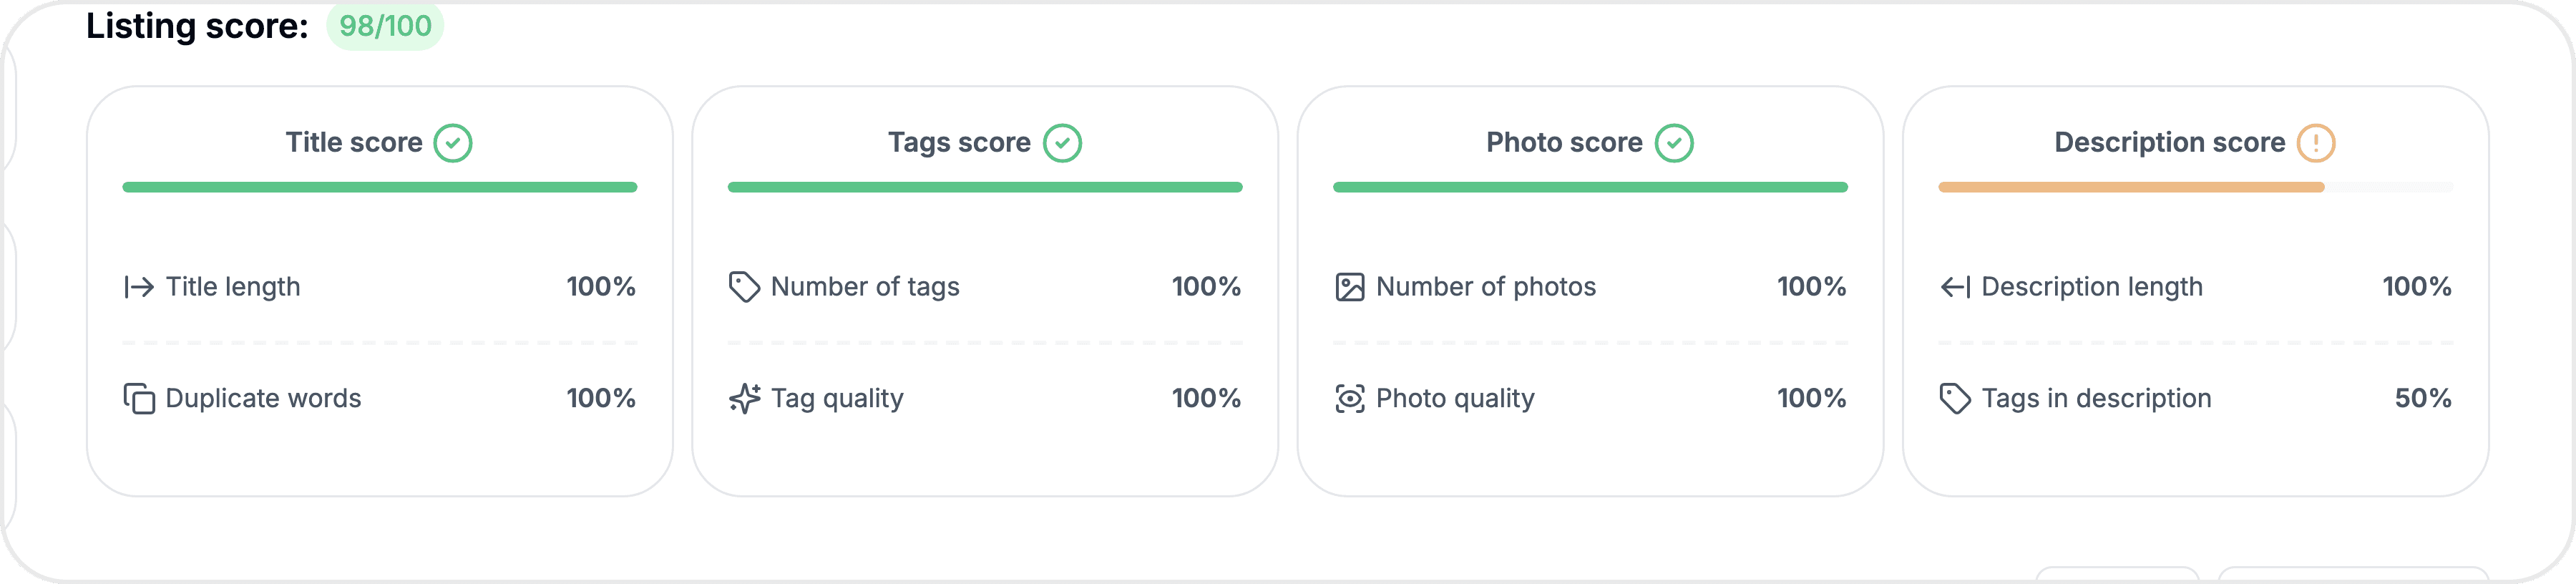
The scoring cards break down the listing's optimization into four areas, each rated 0–100%:
Score | What it measures |
|---|---|
Title | Title length (target: 70–120 characters), duplicate word usage |
Tags | Number of tags used (out of 13 max), tag quality |
Photos | Number and quality of listing images |
Description | Description length and whether tags appear in the description |
An overall Listing Score combines all four into a single number out of 100. Scores are color-coded: green (80+), yellow (60–79), red (below 60).
Use these scores to benchmark competitor listings and identify quick wins for your own — like adding more tags, improving your title length, or writing a more detailed description.
Tags table
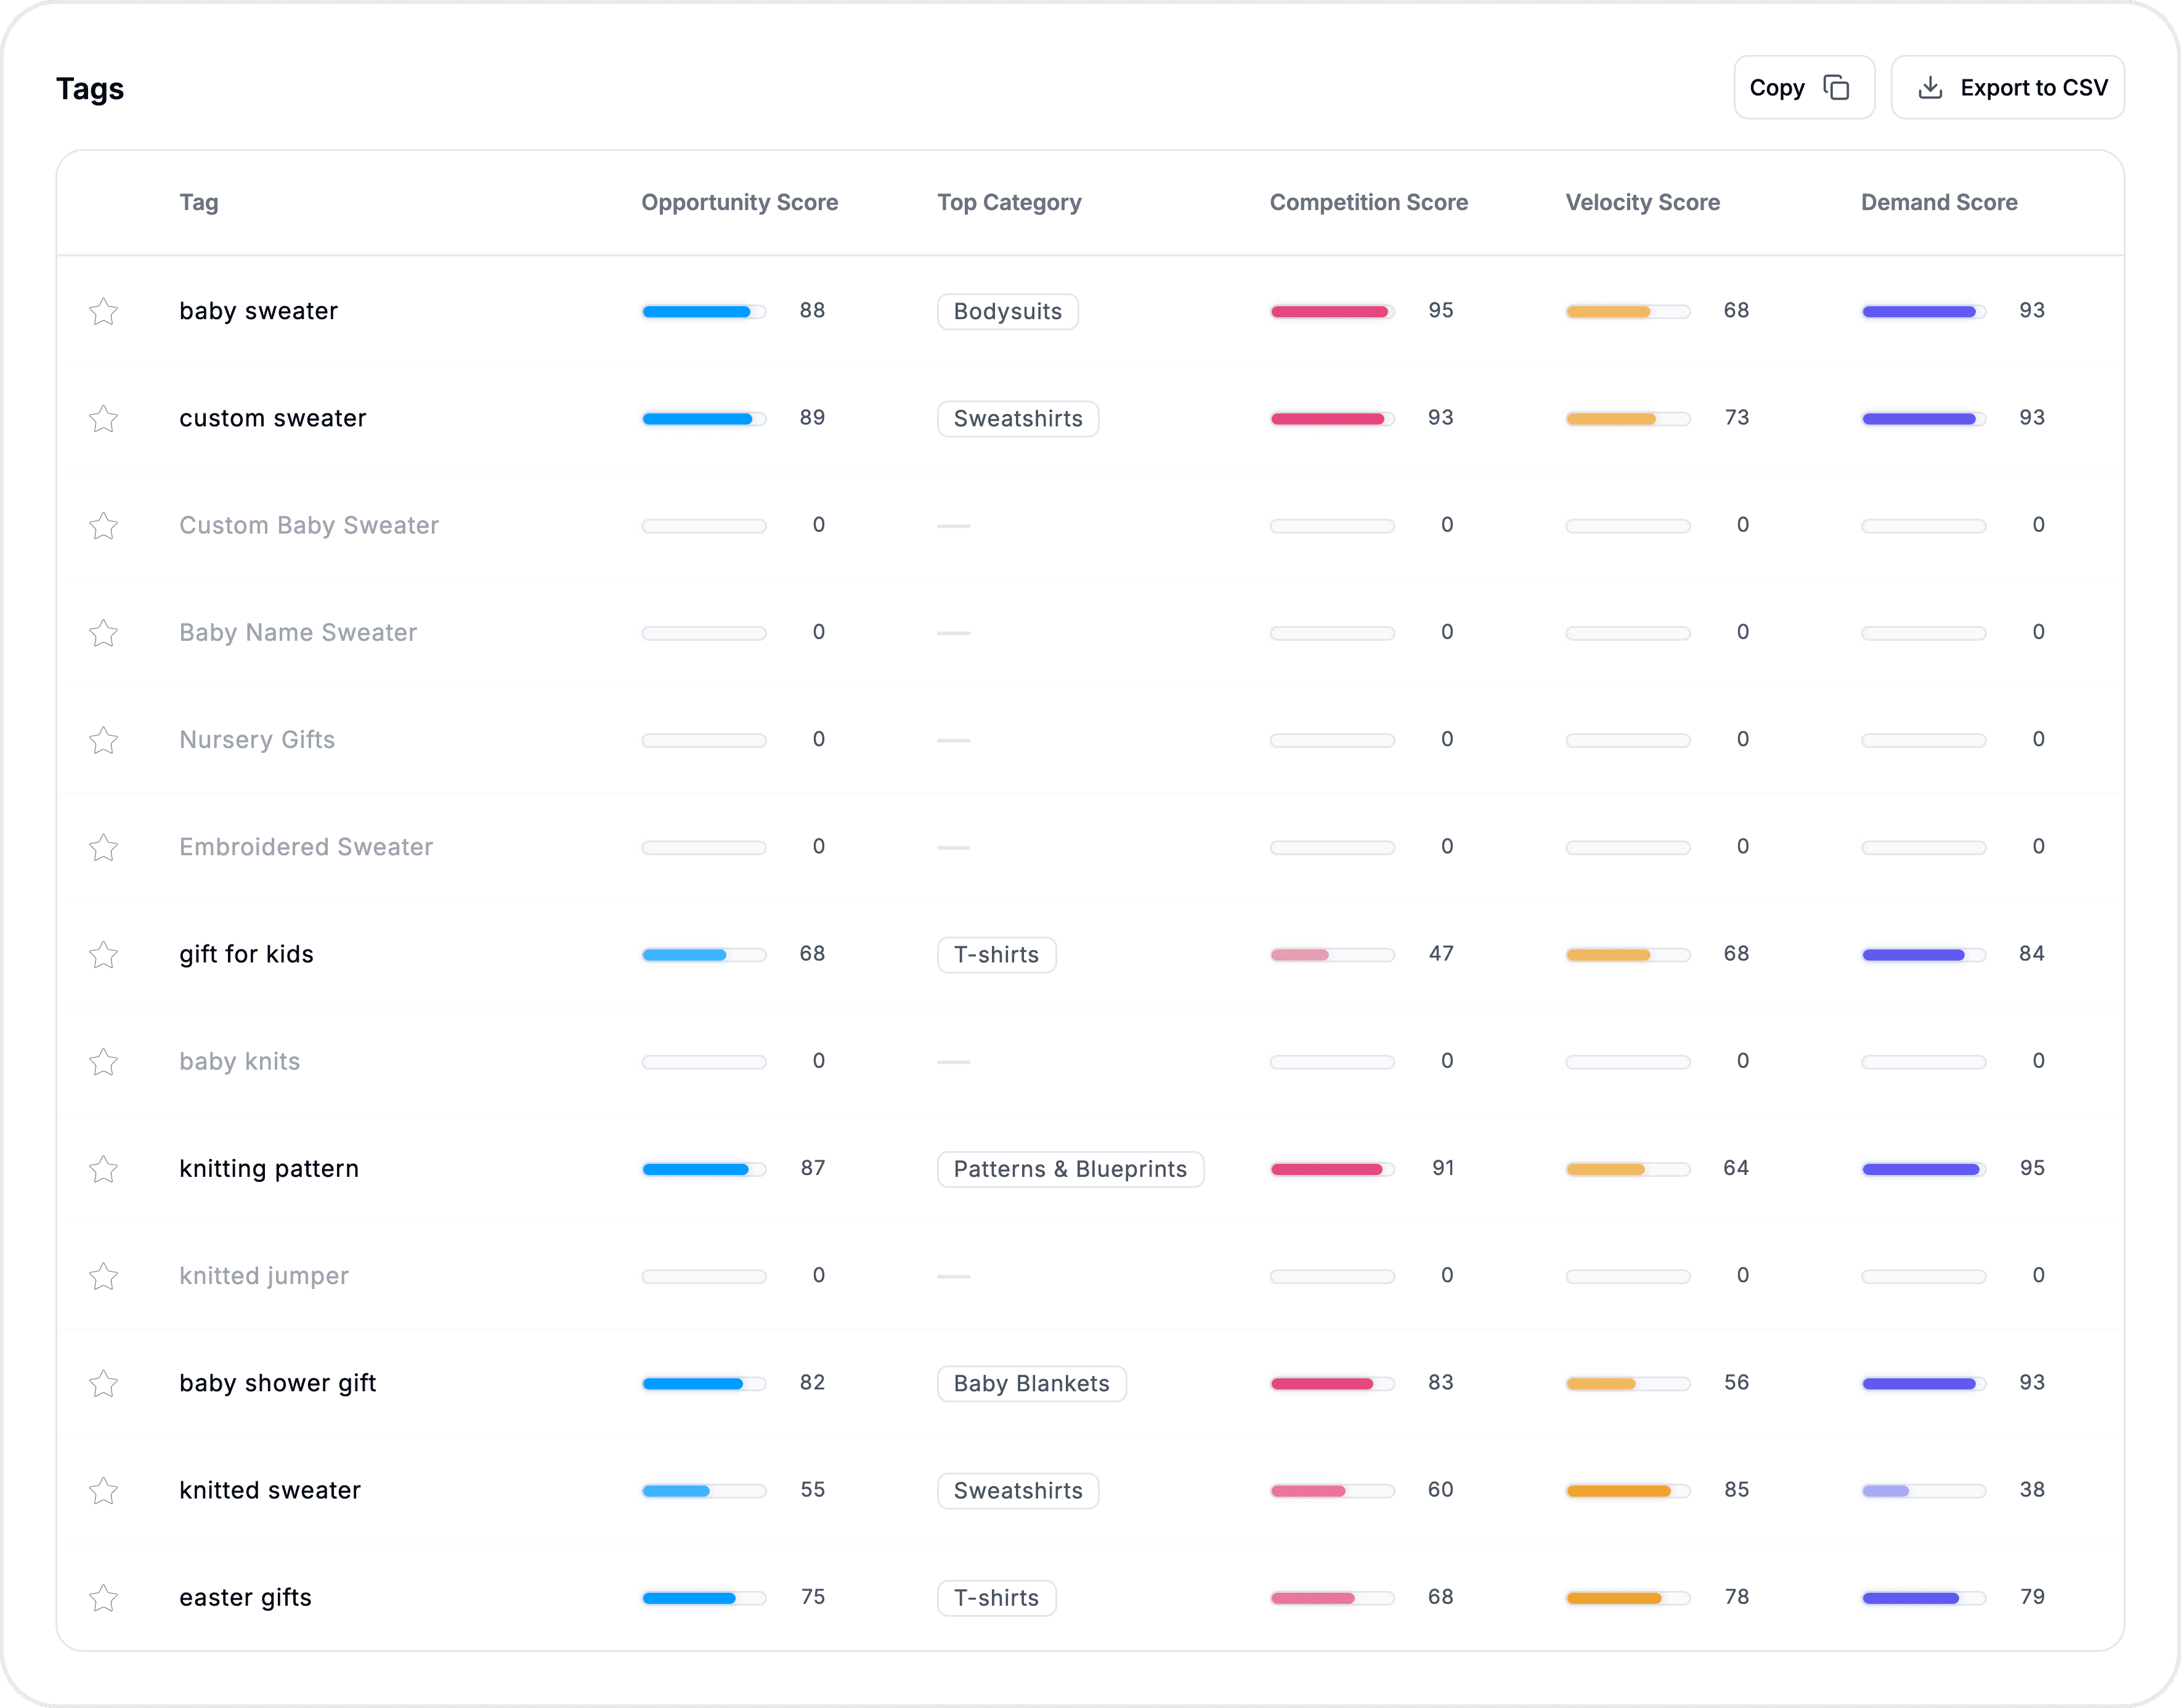
The tags table lists every tag on the listing with keyword-level competitive metrics:
Column | What it shows |
|---|---|
Tag | The keyword/tag itself |
Opportunity Score | Balance of demand vs competition — higher is better |
Competition Score | How saturated the tag is in the marketplace |
Demand Score | Buyer interest level based on search and sales activity |
Velocity Score | How quickly listings with this tag are selling |
Sum Sales / Avg Sales | Total and average sales across listings using this tag |
Sum Revenue / Avg Revenue | Total and average revenue |
List Count | Number of listings using this tag |
Avg Views | Average views for listings with this tag |
Avg Listing Age | Average age of listings using this tag |
Click any column header to sort. Click a tag to open it in Tag Analyzer for deeper analysis.
Copy tags — Click Copy to copy all tags at once (with format options for uppercase, lowercase, or as-is). Right-click any individual tag for single-tag copy options.
Export to CSV — Click Export to CSV to download the full tags table. This is a premium feature.
If a tag is greyed out, that means it's used in less than 50 listings across Etsy.
Shop overview
The shop overview panel shows the parent shop's logo, name, location, and creation date along with four key metrics:
Total Sales — All-time shop sales
Total Revenue — All-time shop revenue
Monthly Sales — Current month sales
Monthly Revenue — Current month revenue
Click the shop name to open it in Shop Analyzer for a full shop-level breakdown. Click the star icon to add the shop to your Watchlist.
Tips & best practices
Sort the tags table by Opportunity Score to find the tags that offer the best balance of demand and low competition — these are the ones worth adding to your own listings.
Compare the Listing Score of top sellers in your niche. If their title scores are high but yours are low, that's a concrete area to improve.
Export the tags table to CSV and cross-reference it with your own keyword research to validate which tags are worth pursuing.
Check the Full Details section for personalization and variation settings — these are easy competitive advantages that many sellers overlook.
Common questions
What do the status badges mean?
Badges like Bestseller, Trending, Outlier, Evergreen, and New reflect a listing's marketplace performance. Outlier means the listing significantly outperforms (or underperforms) its category average.
Why are some metrics locked?
On the free plan, monthly sales, monthly revenue, total revenue, and some tag metrics show a crown icon. These unlock on paid plans.
How is the Listing Score calculated?
It's a composite of four sub-scores — title, tags, photos, and description — based on Etsy seller handbook best practices for optimization.
Related features
Listing Explorer Overview — How to search for listings and navigate the page
Comparing Listings — Similar and new listing recommendations
Tag Analyzer — Deeper tag-level analysis beyond what the tags table shows
Shop Analyzer — Full shop-level performance analysis
Summarize