View Docs
Documentation
Database
Asset Library
Bulk Editor
Listing Explorer
Tag Analyzer
Shop Analyzer
Browser Extension
Policies
Documentation
→
Database
→
Database Overview
Alek
Database Overview
The Database puts Etsy's entire marketplace at your fingertips. Search through over 134 million listings, 3 million shops, and 1.8 million tags — all with real performance data like sales, revenue, and trends. Use it to find what's selling best right now so you can create products that customers actually want.
What you can do with the Database
Search and browse marketplace listings with sales, revenue, pricing, trend, and conversion data
Research shops by performance — sales, reviews, ratings, and more
Analyze tags and keywords with demand, competition, velocity, and opportunity scores
Filter by 19+ criteria to narrow results to your exact niche
Sort by any column to rank data the way you need it
Change timeframes to view sales, revenue, and trends over different periods
Save any listing, shop, or tag to your Watchlist to track competitors
Switch between table view and grid view
Export your current view to CSV
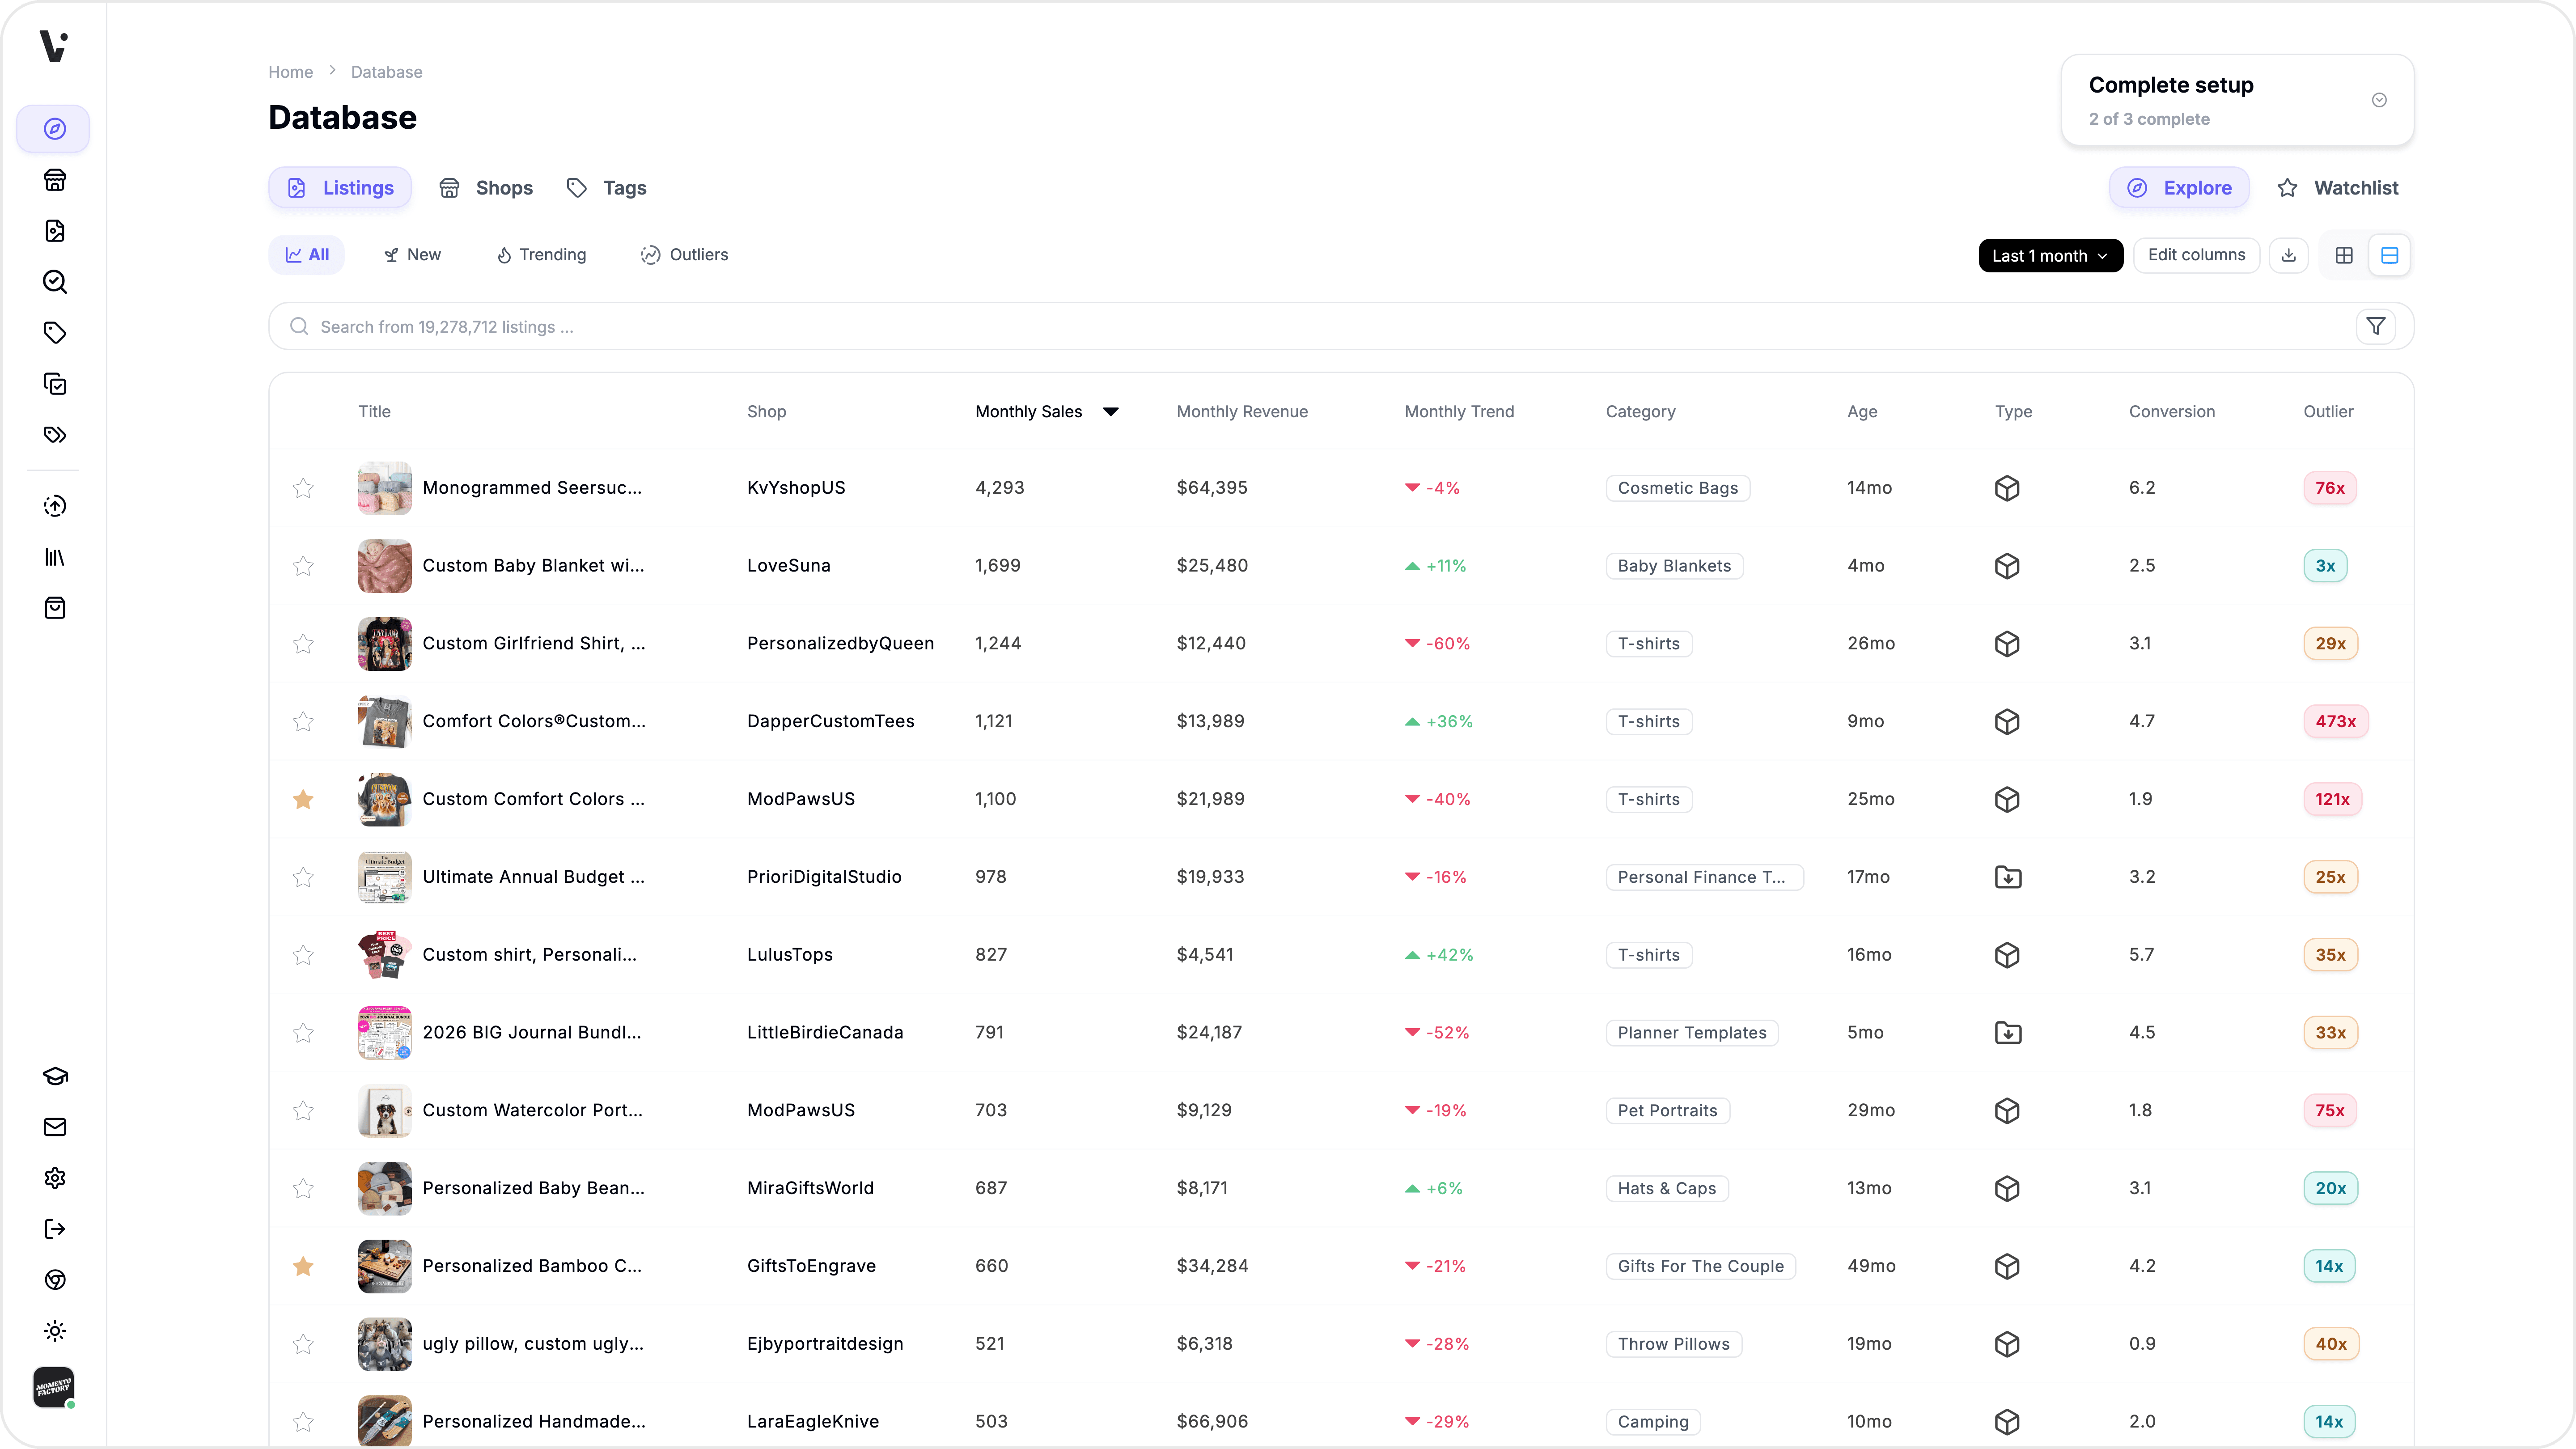
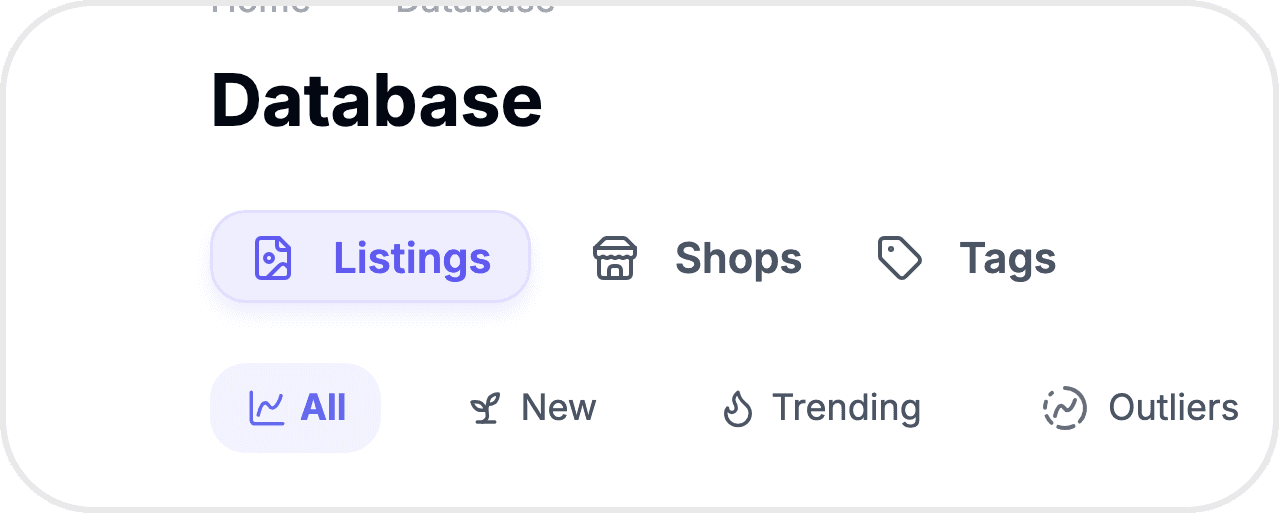
The three tabs
The Database is organized into three tabs, each showing a different slice of the marketplace:
Listings — Product-level data. Every row is an individual Etsy listing with columns for title, shop, price, sales, revenue, trend, category, age, type, conversion rate, and more.
Shops — Shop-level data. Browse Etsy shops by name, sales, revenue, reviews, rating, and other performance metrics.
Tags — Keyword-level data. Explore tags with demand scores, competition scores, velocity, and opportunity scores to find keywords worth targeting.
Explore vs Watchlist
Each tab has two modes you can toggle between:
Explore — Browse all marketplace data. This is the default view and gives you access to the full dataset.
Watchlist — View only items you've saved. Star any listing, shop, or tag to add it to your Watchlist, then switch to Watchlist mode to see them all in one place. This is how you track competitors and monitor products you're interested in.
Viewing your data
Table view vs Grid view — Use the toggle in the toolbar to switch between a spreadsheet-style table and a visual grid of cards. Table view shows more data per row; grid view gives you a visual overview with thumbnails.
Seeing more columns — The table often has more columns than fit on screen. Hold Shift + scroll vertically (mouse wheel) to scroll the table horizontally, or use the scrollbar at the bottom of the table.
Sorting — Click any column header to sort by that column. Click again to reverse the sort order.
Pagination — Use the pagination controls at the bottom to move between pages. You can choose to show 25, 50, or 100 rows per page.
Adding items to your Watchlist
Click the star icon on any row to save that item to your Watchlist. A filled gold star means it's saved; an unfilled star means it's not. You can organize saved items into folders for different research projects or competitor groups.
Related features
Searching & Filtering — Narrow down results using keyword search and 19+ filters
Column Presets — Control which columns appear and use built-in presets for different research goals
Flexible Timeframe — Change the time window for sales, revenue, and trend data
Exporting Data — Download your current view as a CSV file
Listing Explorer — Dive deeper into any individual listing
Watchlist — Manage your saved listings, shops, and tags